Older than 3870 days
Petroleum Supply Monthly
Feb 29, 2016
Supply and disposition of crude oil and petroleum products on a national and regional level. The data series describe production, imports and exports, movements, and inventories.
Company Level Imports
Feb 29, 2016
Imports data at the company level collected from the EIA-814 Monthly Imports Report.
U.S. Movements of Crude Oil By Rail
Feb 29, 2016
Monthly data on rail movements of crude oil have been updated for December 2015. Crude oil movements by rail have significantly increased over the past five years. The new data on crude-by-rail (CBR) movements are also fully integrated with EIA’s existing monthly petroleum supply statistics, which already include crude oil movements by pipeline, tanker, and barge.
Natural Gas Monthly
Feb 29, 2016
• In December, dry natural gas production was the highest for the month since EIA began reporting dry natural gas production data in 1973. Preliminary dry natural gas production for December 2015 was 2,289 billion cubic feet (Bcf), or 73.8 Bcf/day. This level was a 0.4 Bcf/day (0.6%) increase from December 2014 production of 73.4 Bcf/day.
• Preliminary dry natural gas consumption for December 2015 was 2,598 Bcf, or 83.8 Bcf/day. This was a decrease of 3.3% from 2,688 Bcf in December 2014, or 2.9 Bcf/day.
• Year-over-year total consumption of dry natural gas in December decreased in three of the four consuming sectors, with the exception being electric power deliveries, which increased significantly year to year. Deliveries of natural gas by consuming sector in December 2015 were as follows:
o Residential deliveries were 589 Bcf, or 19.0 Bcf/day, down 17.9% from 23.1 Bcf/day in December 2014.
o Commercial deliveries were 351 Bcf, or 11.3 Bcf/day, down 17.8% from 13.8 Bcf/day in December 2014.
o Industrial deliveries were 669 Bcf, or 21.6 Bcf/day, down 2.8% from 22.2 Bcf/day in December 2014.
o Electric power deliveries were 771 Bcf, or 24.9 Bcf/day, up 21.2% from 20.5 Bcf/day in December 2014.
• Preliminary annual dry natural gas production for 2015 was 27,091 Bcf, or 74.2 Bcf/day, the highest annual total on record dating back to 1930. Preliminary annual total consumption for 2015 was 27,473 Bcf, or 75.3 Bcf/day, also the highest total on record dating back to 1949.
Crude Oil Imports From Persian Gulf
Feb 29, 2016
Persian Gulf report for January through December 2015
Monthly Biodiesel Production Report
Feb 29, 2016
The U.S. Energy Information Administration released new data today showing national and regional monthly biodiesel production for December 2015. In addition to biodiesel production, data included producer sales, producer stocks, and feedstock inputs.
Monthly Crude Oil and Natural Gas Production
Feb 29, 2016
These monthly production estimates are based on data from the EIA-914, Monthly Crude Oil, Lease Condensate, and Natural Gas Production Report. Beginning in January 2015, ten states were added to the EIA-914, bringing to 16 the number of states/areas with individual coverage, and crude oil production estimates were introduced. Estimates based on the EIA-914 are now provided for Arkansas, California, Colorado, Kansas, Louisiana, Montana, New Mexico, North Dakota, Ohio, Oklahoma, Pennsylvania, Texas, Utah, West Virginia, Wyoming, and the Federal Gulf of Mexico. For natural gas, production for the remaining producing states (except Alaska) is reported in a single “Other states” entry. For crude oil, production from states/areas not individually covered in the EIA-914 is based on EIA’s previous estimation methodology. A document detailing EIA’s sampling and estimation methodology is available in the "Additional data and methodology" section at the right.
Oil and Gas Field Code Master List
Feb 24, 2016
Comprehensive listing of U.S. oil and gas field names.
Monthly Energy Review
Feb 24, 2016
EIA's most comprehensive report on recent integrated energy statistics. Preliminary estimates indicate that in November 2015, U.S. primary energy consumption totaled 7.7 quadrillion Btu, a 6% decrease from November 2014.
Prime Supplier Report
Feb 23, 2016
The latest Prime Supplier Report presents data collected through December 2015 on Form EIA-782C, "Monthly Report of Prime Supplier Sales of Petroleum Products Sold for Local Consumption." These data measure primary petroleum product deliveries into the states where they are locally marketed and consumed.
State Energy Data System: Natural gas for 2014
Feb 19, 2016
Annual state-level estimates of natural gas consumption, prices, and expenditures.
State Energy Profiles: New data for November and December 2015 and updated analytical narratives
Feb 18, 2016
New monthly data are available for electricity, petroleum, and coal series. In addition, analytical narratives have been updated for Kansas, Nebraska, North Dakota, and South Dakota.
Domestic Uranium Production Report - Quarterly
Feb 18, 2016
Fourth quarter 2015 update of uranium production in the United States and operating status of U.S. uranium mills and plants.
Electric Power Annual 2014
Feb 16, 2016
The Electric Power Annual 2014 (EPA 2014) Report is now available with final data through 2014. The 2014 EPA presents 11 years (2004-14) of national-level data on electricity generating capacity, electricity generation and useful thermal output, fuel receipts, consumption, and emissions.
State Energy Data System: Other petroleum products for 2014
Feb 12, 2016
Annual state-level estimates of consumption, prices, and expenditures for other petroleum products for 2014. “Other petroleum products” is a category that comprises 16 products, including still gas, petroleum coke, petrochemical feedstocks, and pentanes plus.
Short-Term Energy Outlook - Market Prices and Uncertainty Report
Feb 9, 2016
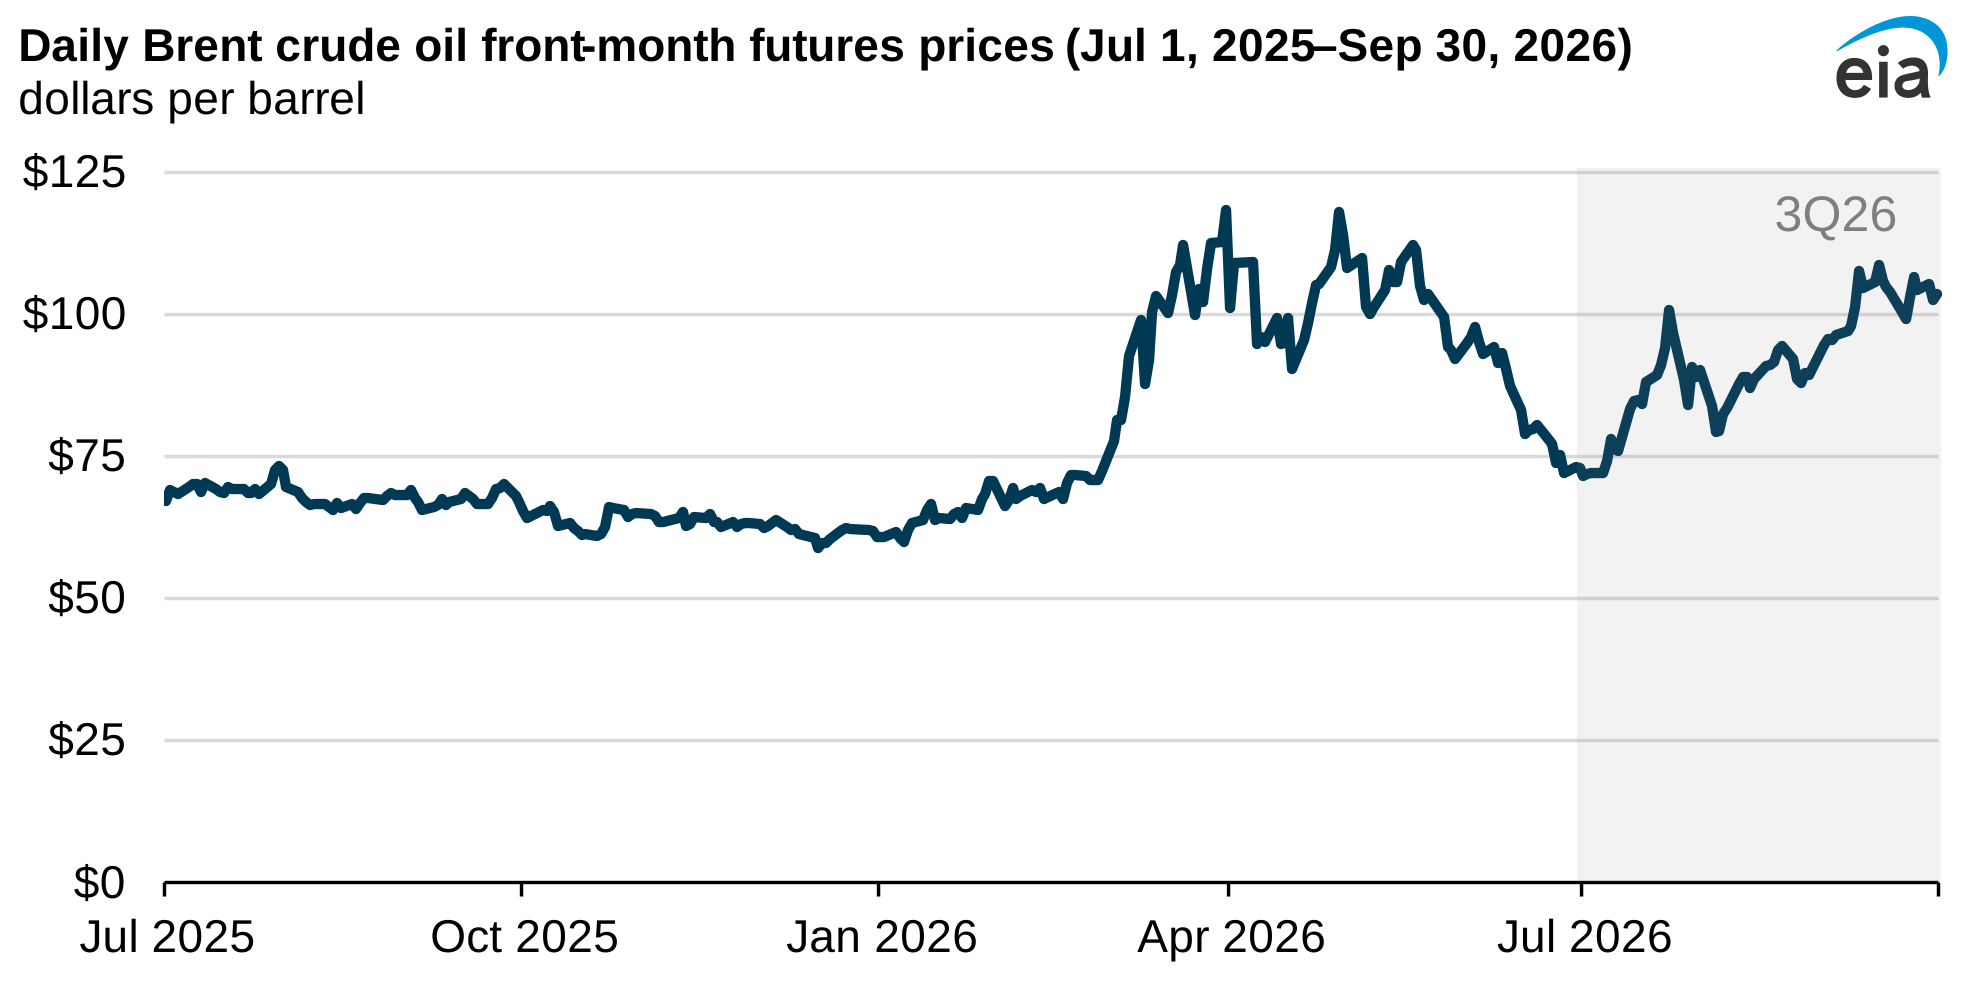
The North Sea Brent front month futures price settled at $34.46/b on February 4 $2.76 per barrel (b) below its January 4 level. The West Texas Intermediate (WTI) front month futures price settled at $31.72, a decrease of $5.04/b over the same period. On January 20, both Brent and WTI were at their lowest levels since 2003.
Short-Term Energy Outlook
Feb 9, 2016
North Sea Brent crude oil prices averaged $31/barrel (b) in January, a $7/b decrease from December and the lowest monthly average price since December 2003. Brent crude oil prices averaged $52/b in 2015, down $47/b from the average in 2014. Growth in global liquids inventories, which averaged 1.8 million barrels per day (b/d) in 2015, continues to put downward pressure on Brent prices.
The Availability and Price of Petroleum and Petroleum Products Produced in Countries Other Than Iran
Feb 9, 2016
Number 25 in a series of reports required by section 1245 (d) (4) (A) of the National Defense Authorization Act for Fiscal Year 2012, which requires that, not later than 60 days from enactment and every 60 days thereafter, the U.S. Energy Information Administration (EIA) “submit to Congress a report on the availability and price of petroleum and petroleum products produced in countries other than Iran in the 60-day period preceding the submission of the report.”
EIA-63B Annual Photovoltaic Cell/Module Shipments Report, 2013
Feb 9, 2016
This site contains summary data for the photovoltaic industry in the United States. Data including manufacturing, imports, and exports of modules in the United States and its territories. Summary data include volumes in peak kilowatts and average prices. Where possible, imports and exports are listed by country, and shipments to the United States are listed by state. To protect the confidentiality of company-level data, some data elements have been combined. For example, data for some countries cannot be individually listed. In addition, data by technology type can no longer be published.
Previous yearly reports included more detailed summary reports and tables. Differences in these tables are highlighted in the current report.
Drilling Productivity Report
Feb 8, 2016
EIA’s monthly Drilling Productivity Report (DPR) has been released. The DPR takes a fresh look at oil and natural gas production, starting with an assessment of how and where drilling for hydrocarbons is taking place. It uses recent data on the total number of drilling rigs in operation along with estimates of drilling productivity and estimated changes in production from existing oil and natural gas wells to provide estimated changes in oil and natural gas production for seven key fields.
East Coast and Gulf Coast Transportation Fuels Markets
Feb 3, 2016
This study examines supply, consumption, and distribution of transportation fuels in Petroleum Administration for Defense Districts (PADDs) 1 and 3, or the U.S. East Coast and the Gulf Coast, respectively. The East Coast region includes states from Maine to Florida along the U.S. Atlantic Coast. The Gulf Coast region comprises states between New Mexico in the west to Alabama in the east along the Gulf of Mexico. For this study, transportation fuels include gasoline, diesel fuel and jet fuel. Residual fuel oil supply is also analyzed where applicable.
Petroleum Marketing Monthly
Feb 1, 2016
The February 2016 Petroleum Marketing Monthly (PMM), with data through November 2015, presents monthly and annual price and volume statistics covering crude oil and refined products sales in the United States.
In this issue of the PMM, preliminary November 2015 data show prices for crude oil and finished petroleum products on the decline from October levels. U.S.-level Prime Supplier data show gasoline sales fell month-on-month, but remained above year-ago levels, while sales of propane show the opposite trend.