Older than 2760 days
Wholesale Electricity Market Data
Mar 14, 2019
This site contains spreadsheets with wholesale electricity and natural gas data from eight major trading hubs that cover most regions of the United States. The data are through March 12, 2019 and are republished, with permission, from the Intercontinental Exchange (ICE).
Lower 48 working natural gas stocks hit a new record for largest weekly net withdrawals in March
Mar 14, 2019
Net withdrawals for the Lower 48 states totaled 204 billion cubic feet (Bcf) for the week ending March 8, 2019. This value is the largest value ever reported for March in the Weekly Natural Gas Storage Report (WNGSR). Out of the 20 largest reported March withdrawals, 5 have occurred since 2014, including last week’s (week ending March 1, 2019) reported net withdrawal of 149 Bcf. On a regional basis, net withdrawals totaled 88 Bcf and 51 Bcf in the South Central and South Central salt regions, respectively, setting new March highs since EIA adopted the five-region breakout. The Mountain region also set a new March record, posting withdrawals of 7 Bcf.
Monthly Solar Photovoltaic Module Shipments Report
Mar 13, 2019
This report contains monthly summary data for the photovoltaic industry in the United States. Data include manufacturing, imports, and exports of modules in the United States and its territories. Summary data include volumes in peak kilowatts and average prices. Where possible, imports and exports are listed by country, and shipments to the United States are listed by state.
Short-Term Energy Outlook
Mar 12, 2019
Brent crude oil spot prices averaged $64 per barrel (b) in February, up $5/b from January 2019 and about $1/b lower than at the same time last year. EIA forecasts Brent spot prices will average $63/b in 2019 and $62/b in 2020, compared with an average of $71/b in 2018. EIA expects that West Texas Intermediate (WTI) crude oil prices will average $9/b lower than Brent prices in the first half of 2019 before the discount gradually falls to $4/b in the fourth quarter of 2019 and throughout 2020.
Working natural gas inventories in Southern California decrease to less than 36 billion cubic feet
Mar 12, 2019
Working natural gas inventories in the Southern California Natural Company (SoCalGas) storage system have decreased during the winter (November through March) to about 35.9 billion cubic feet (Bcf) as of March 11, down more than 50% from about 81 Bcf in early November 2018. Inventories are now historically low; only five winters since 2001 have seen natural gas inventories dip lower than current levels, according to the SoCalGas data on its public electronic bulletin board. SoCalGas natural gas stocks have not been as low as they are now since February 2014, when natural gas stocks fell materially throughout much of the country because of episodes of cold weather related to polar vortex weather conditions.
Company Level Imports
Mar 8, 2019
Imports data at the company level collected from the EIA-814 Monthly Imports Report.
Petroleum Supply Monthly
Mar 8, 2019
Supply and disposition of crude oil and petroleum products on a national and regional level. The data series describe production, imports and exports, movements, and inventories.
U.S. Movements of Crude Oil By Rail
Mar 8, 2019
Monthly data on rail movements of crude oil have been updated for December 2018. Crude oil movements by rail have significantly increased over the past five years. The data on crude-by-rail (CBR) movements are also fully integrated with EIA’s existing monthly petroleum supply statistics, which already include crude oil movements by pipeline, tanker, and barge.
Petroleum Marketing Monthly
Mar 1, 2019
The March 2019 Petroleum Marketing Monthly (PMM), with data through December 2018, presents monthly and annual price and volume statistics covering crude oil and refined petroleum products sales in the United States. Additionally, updated state gasoline and diesel fuel tax information is available on the PMM webpage.
Petroleum Supply Monthly
Feb 28, 2019
Supply and disposition of crude oil and petroleum products on a national and regional level. The data series describe production, imports and exports, movements, and inventories. Notice: Revised Petroleum Supply Monthly (PSM) data for November 2018 released.
Monthly Biodiesel Production Report
Feb 28, 2019
Monthly national and regional biodiesel production data for December 2018. In addition to biodiesel production, data included producer sales, producer stocks, and feedstock inputs.
Natural Gas Monthly
Feb 28, 2019
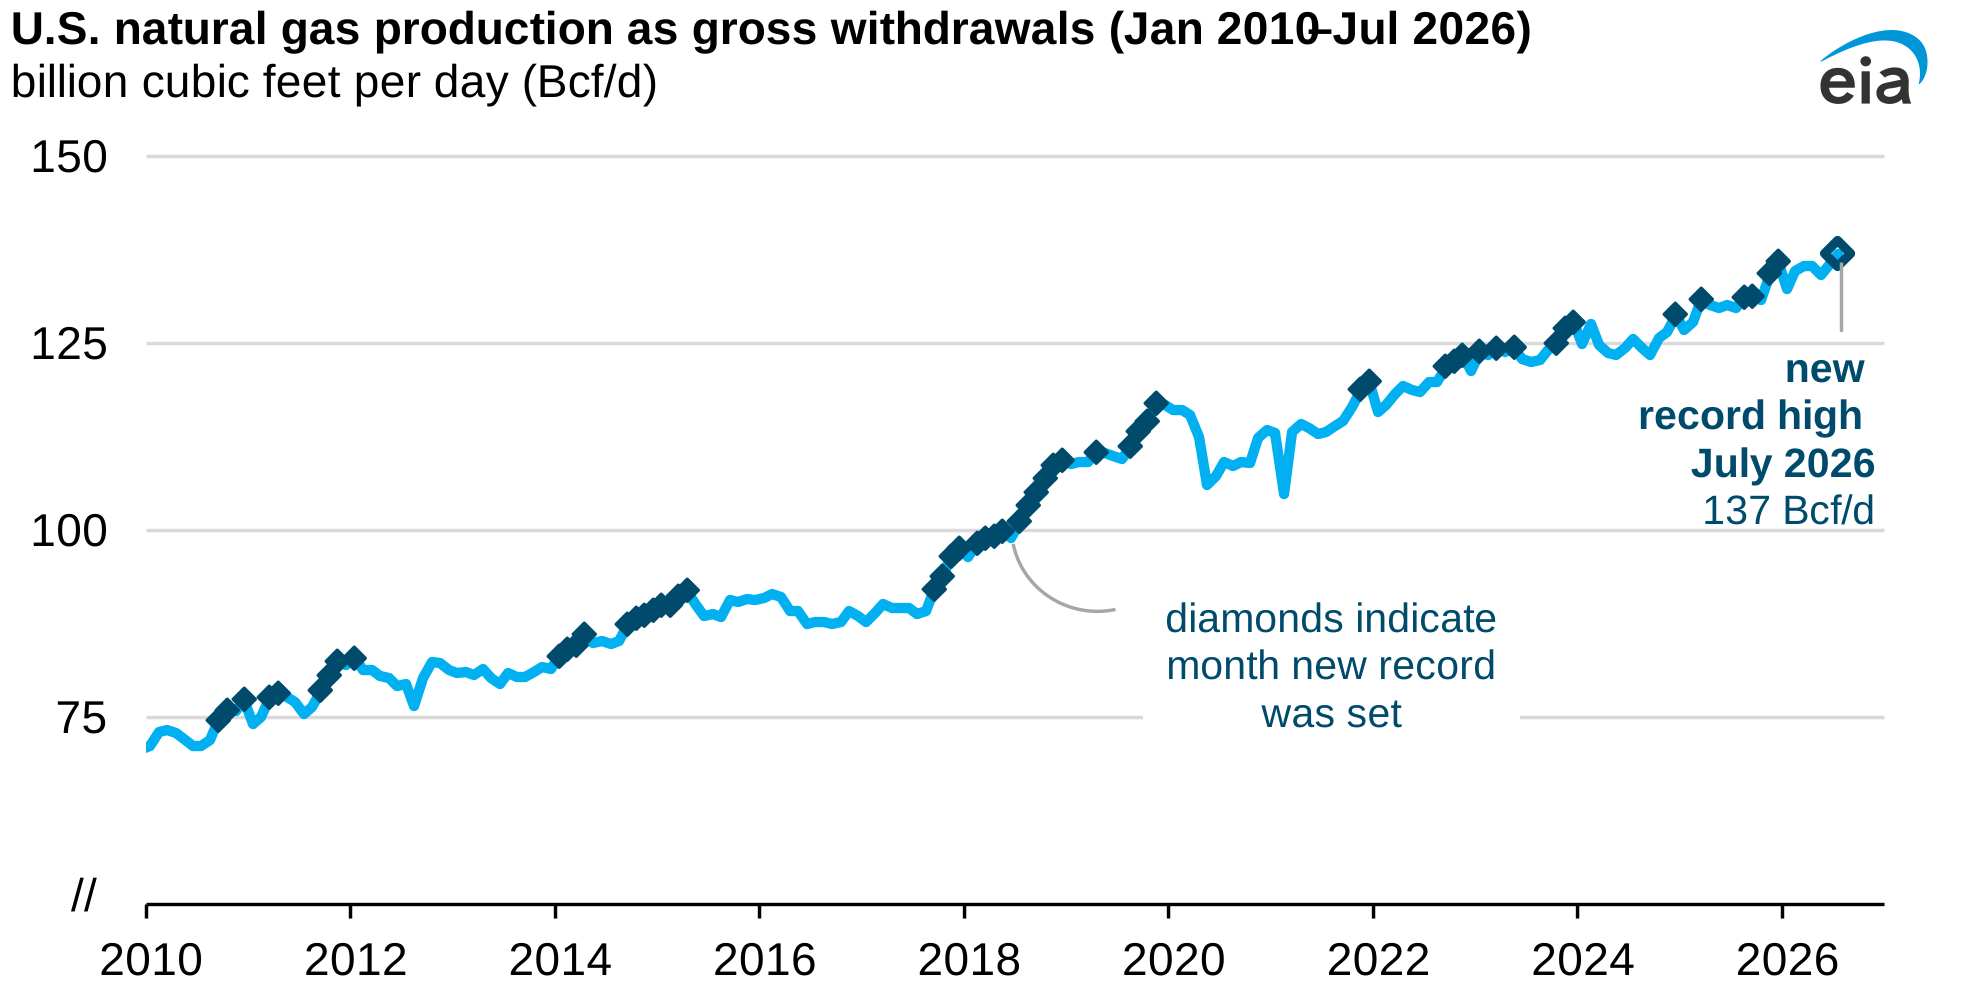
In December 2018, for the 20th consecutive month, dry natural gas production increased year to year for the month. The preliminary level for dry natural gas production in December 2018 was 2,746 billion cubic feet (Bcf), or 88.6 Bcf/d. This level was 9.1 Bcf/d (11.5%) higher than the December 2017 level of 79.5 Bcf/d. The average daily rate of dry natural gas production for December was the highest for any month since EIA began tracking monthly dry natural gas production in 1973.
Company Level Imports
Feb 28, 2019
Imports data at the company level collected from the EIA-814 Monthly Imports Report.
Monthly Crude Oil and Natural Gas Production
Feb 28, 2019
These monthly production estimates are based on data from the EIA-914, Monthly Crude Oil, Lease Condensate, and Natural Gas Production Report.
Wholesale Electricity and Natural Gas Market Data
Feb 28, 2019
This site contains spreadsheets with wholesale electricity and natural gas data from eight major trading hubs that cover most regions of the United States. The data are through February 26, 2019 and are republished, with permission, from the Intercontinental Exchange (ICE).
Monthly Solar Photovoltaic Module Shipments Report
Feb 28, 2019
This report contains monthly summary data for the photovoltaic industry in the United States. Data include manufacturing, imports, and exports of modules in the United States and its territories. Summary data include volumes in peak kilowatts and average prices. Where possible, imports and exports are listed by country, and shipments to the United States are listed by state.
Electricity Monthly Update
Feb 27, 2019
This month’s Electric Monthly Update contains data for December 2018 and a feature article on how Hurricane Florence caused electric outages and affected net generation patterns in North and South Carolina.
Energy-Related Carbon Dioxide Emissions by State, 2005-2016
Feb 27, 2019
Energy-related carbon dioxide (CO2) emissions vary significantly across states, whether considered on an absolute basis or on a per capita basis. Total state CO2 emissions include those from direct fuel use across all sectors, including residential, commercial, industrial, and transportation, as well as primary fuels consumed for electricity generation.
Electric Power Monthly
Feb 27, 2019
Data in the February 2019 Electric Power Monthly (EPM) are for December 2018, during which net generation in the United States fell 4.6% from the December 2017 level. Consumption of natural gas for power generation was down 5.2% compared to December 2017. The average residential retail price of electricity for December 2018 was up 0.2% from what it had been in December 2017.
Monthly Energy Review
Feb 25, 2019
The Monthly Energy Review is EIA's comprehensive report on recent and historical energy statistics. Preliminary data indicate that U.S. net imports of energy fell from 0.4 quadrillion British thermal units (Btu) in November 2017 to 0.1 quadrillion Btu in November 2018, a 71% decrease.
Prime Supplier Report
Feb 22, 2019
The latest Prime Supplier Report presents data through December 2018 on Form EIA-782C, "Monthly Report of Prime Supplier Sales of Petroleum Products Sold for Local Consumption." These data measure primary product deliveries into the states where they are locally marketed and consumed.
State Energy Data System: Coal through 2017
Feb 22, 2019
Annual state-level estimates of coal consumption, prices, and expenditures through 2017.
State Energy Profiles: New monthly data for November and December 2018, new annual data, and updated Profile Analyses and Quick Facts
Feb 21, 2019
New monthly data are available for
- Electricity
- Petroleum
- Natural gas
- Coal
New annual data are available for
- Natural gas consumption and expenditures
- Average temperature
- Precipitation
In addition, Profile Analyses and Quick Facts have been updated for
- Arkansas
- Louisiana
- Oklahoma
- Texas
Petroleum Marketing Survey Form Changes Proposed for 2019
Feb 19, 2019
A Federal Register Notice (FRN) was published on February 19, 2019 regarding proposed changes to the Petroleum Marketing Program. The ten surveys collect price and volume information to determine supply of and demand for crude oil and refined petroleum products.
Drilling Productivity Report
Feb 19, 2019
The Drilling Productivity Report (DPR) uses recent data on the total number of drilling rigs in operation along with estimates of drilling productivity and estimated changes in production from existing oil and natural gas wells to provide estimated changes in oil and natural gas production for seven key regions.
Historical inventory patterns suggest that working gas stocks will remain in the five-year range but below the five-year average for the remainder of the winter
Feb 15, 2019
Working gas stocks totaled 1,882 billion cubic feet (Bcf) as of February 8, 2019, marking the fifth week in a row that working gas stocks are within the five-year (2014–18) range, after entering the 2018–19 heating season (October 31–March 31) at the lowest level since 2002.
Wholesale Electricity and Natural Gas Market Data
Feb 14, 2019
This site contains spreadsheets with wholesale electricity and natural gas data from eight major trading hubs that cover most regions of the United States. The data are through February 12, 2019 and are republished, with permission, from the Intercontinental Exchange (ICE).
Natural Gas Processing Capacity in the Lower 48 States
Feb 14, 2019
State-level estimates of natural gas processing plant capacity, throughput, utilization, and heat content are now available for 2017. Estimates show processing plant capacity and throughput each increasing by about 5% on a net basis for the Lower 48 states between 2014 and 2017.