
Solar capacity additions are changing the shape of daily electricity supply in Texas
Reposted on April 10, 2024 to correct multiple errors.
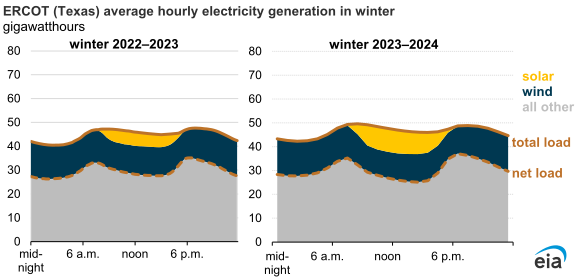
Note: Other fuels include coal, natural gas, hydropower, and nuclear. Utility-scale solar only. Winter is the full months of December, January, and February. ERCOT=Electric Reliability Council of Texas.
The electricity mix of energy sources in Texas, managed by the Electric Reliability Council of Texas (ERCOT) electricity grid operator, changed noticeably in 2023. Although wind power remains the largest source of renewable power in the state, the installation of new wind turbine capacity slowed in 2023, while additions of solar generating capacity, often co-located with storage, grew rapidly. With more solar capacity on the ERCOT electricity grid, we expect less use of natural gas generation during the middle of the day when solar generation displaces it. We also expect less use of natural gas in the summer when electricity demand is at its highest in Texas. However, natural gas will continue to be a key source of electricity generation in the evening when demand is high and solar generation diminishes as the sun goes down.
In Texas’s wholesale electricity markets, natural gas-fired electricity generation usually helps balance changes in electricity demand with daily cycles in wind and solar electricity generation. This dispatch pattern is somewhat similar to that in California, often referred to as a duck curve. Electricity output from natural gas-fired power plants is often greatest in the evening between 6:00 p.m. and 8:00 p.m. Most solar power is generated in Texas by midday. As solar power generation declines later in the afternoon, natural gas is dispatched to meet the electricity demand. Wind generation also increases in the evening, limiting the need for additional generation from natural gas or other dispatchable resources.
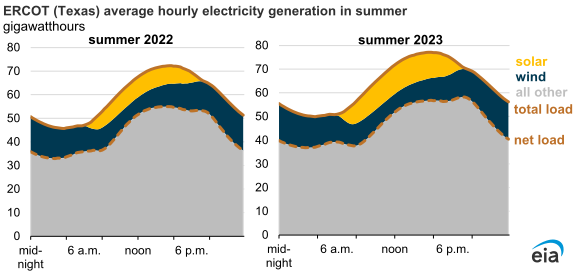
Note: Other fuels include coal, natural gas, hydropower, and nuclear. Utility-scale solar only. Summer is the full months of June, July, and August. ERCOT=Electric Reliability Council of Texas.
The hourly average solar generation during the winter of 2022–23 was 1.9 gigawatthours (GWh) and increased to 3.3 GWh in the winter of 2023–24. The hourly average wind generation slightly decreased during the same period from 13.8 GWh to 13.2 GWh. In the summer of 2022, the hourly average solar generation was 3.6 GWh and increased to 5.1 GWh in the summer of 2023. The hourly average wind generation remained unchanged during the same period at 11.2 GWh.
Despite contributing more renewable generation than any other source in Texas, wind generation in 2023 remained essentially unchanged from 2022, whereas solar generation increased by 35% year over year. During 2023, Texas produced about 108,000 GWh from wind power and about 32,000 GWh from utility-scale solar generators.
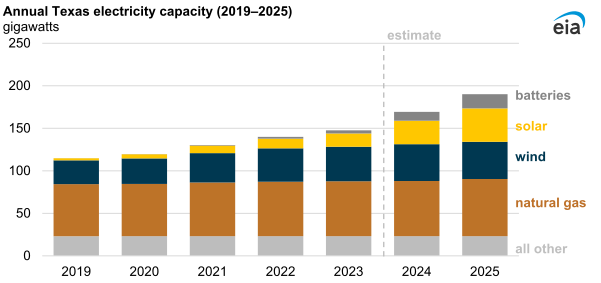
Note: Estimates include operational installed generating capacity and planned capacity additions.
The increase in solar power generation in Texas has come as solar capacity has been rapidly added to the grid. In 2023, installed solar capacity in Texas totaled about 16 gigawatts (GW). Power plant developers are planning to add around 24 GW of solar power net summer capacity to the grid in 2024 and 2025, compared with only 3 GW of additional wind power nameplate capacity during the same period. In addition, developers are planning to add 13 GW of battery storage to the electricity grid between now and 2025. By contrast, we estimate 3 GW of added natural gas capacity over the next two years.
Principal contributors: Katherine Antonio, Kimberly Peterson
Tags: generation, electricity, renewables, Texas, solar, states