
U.S. natural gas consumption reached record daily high in late December 2022
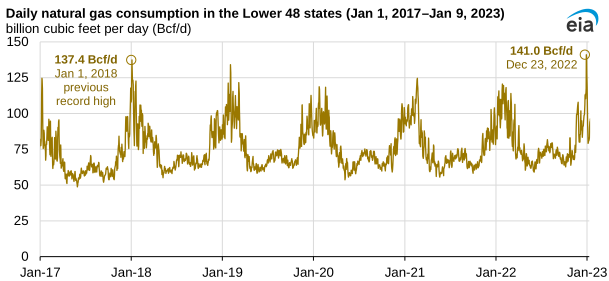
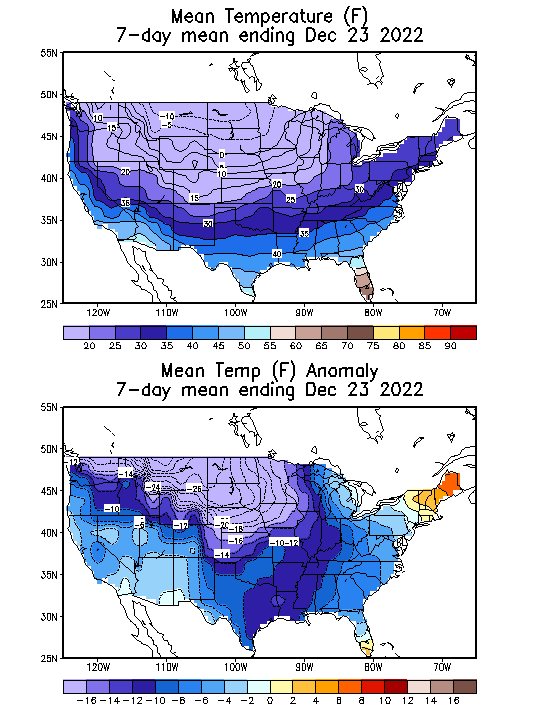
On December 23, 2022, natural gas consumption in the U.S. Lower 48 states reached a daily record high of 141.0 billion cubic feet (Bcf), according to estimates from S&P Global Commodity Insights. The previous record was 137.4 Bcf, set on January 1, 2018. Below-normal temperatures in mid- to late December increased demand for natural gas used for residential and commercial space heating and electric power generation. At the same time, natural gas production quickly fell because of mechanical issues caused by the cold temperatures.
From December 21 through December 26, 2022, a winter storm moved across North America, bringing blizzards, high winds, and extremely cold temperatures to a large portion of the United States. Increased demand for space heating in both the residential and commercial sectors was primarily met by natural gas. On those six days, residential and commercial sector natural gas consumption averaged 60.9 billion cubic feet per day (Bcf/d), or 55% higher than the five-year (2017–21) average.
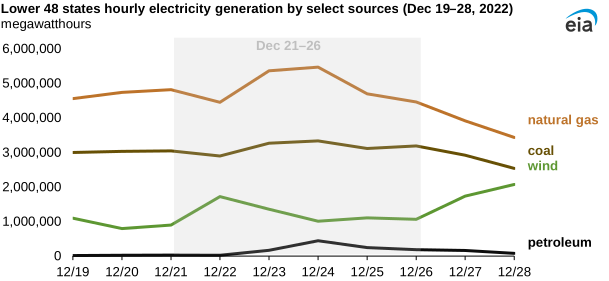
Natural gas consumption in the electric power sector averaged 37.8 Bcf/d from December 21 through December 26, or 45% higher than the five-year average (26.0 Bcf/d) for those days. Electric power utilities used more natural gas, coal, wind, and oil to meet the higher-than-average demand for electricity. The Tennessee Valley Authority (TVA), the Electric Reliability Council of Texas (ERCOT), and the Southwest Power Pool (SPP) reported record-high electric power generation during the winter storm.
Although U.S. natural gas demand increased, production fell. Dry natural gas production in the Lower 48 states dropped to a low of 82.5 Bcf on December 24, a 16% decrease (16.1 Bcf/d) from December 21, according to data from S&P Global Commodity Insights. The last time U.S. natural gas production rapidly declined to this degree was during a February 2021 winter storm. Higher-than-average natural gas demand during the December storm was met by increasing both withdrawals from storage and pipeline imports from Canada.
Natural gas withdrawals from working underground storage across the Lower 48 states totaled 213.0 Bcf for the week ending December 23 and 221.0 Bcf for the week ending December 30. In 2021, withdrawals were 136.0 Bcf for the week ending December 24.
Natural gas pipeline imports from Canada supplied 10.4 Bcf of natural gas to the United States on December 24, the highest natural gas imports from Canada in one day since February 2007, according to data from S&P Global Commodity Insights.
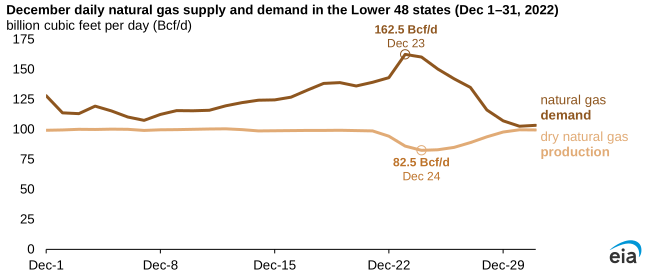
Note: Total demand includes total consumption, pipeline exports, liquefied natural gas (LNG) feedgas deliveries, and pipeline loss and fuel.
Principal contributors: James Easton, Max Ober
Tags: consumption/demand, coal, natural gas, weather, wind, oil/petroleum