
EIA estimates that global petroleum liquids consumption dropped 9% in 2020
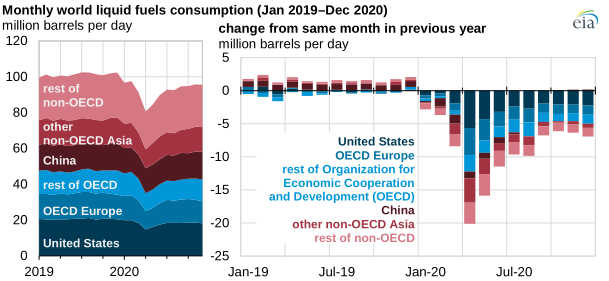
Responses to the coronavirus disease (COVID-19) caused global demand for petroleum products to fall significantly in 2020. The U.S. Energy Information Administration (EIA) estimates that the world consumed 92.2 million barrels per day (b/d) of petroleum and other liquid fuels in 2020, a 9% decline from the previous year and the largest decline in EIA’s series that dates back to 1980. A supplement to EIA’s Short-Term Energy Outlook (STEO) describes developments in global oil consumption during 2020, methods for estimating and forecasting global oil consumption, and expectations for oil consumption in 2021 and 2022.
In its short-term outlook, EIA forecasts changes in U.S. petroleum consumption in response to variables including economic growth, employment growth, vehicle fleet fuel efficiency, and oil prices. For the rest of the world, EIA uses a combination of available real-time data and models based on the relationship between gross domestic product (GDP) and oil consumption. Because of the unique effects of the pandemic in 2020, EIA relied on a wider set of other indicators to assess non-U.S. energy demand, including third-party indexes that tracked mobility, flights, and government stay-at-home orders and their stringency across countries.
A previous Today in Energy article described how EIA uses data series from our Weekly Petroleum Status Report and our Petroleum Supply Monthly (with a two-month lag in the data) to inform short-term forecasts of U.S. petroleum markets. The United States is the world’s largest consumer of petroleum liquids, accounting for 20% of the global total in 2019.
Other countries in the Organization for Economic Cooperation and Development (OECD) provide monthly consumption data after a two- to three-month lag. Collectively, the 37 OECD member countries consumed 47% of global petroleum liquids in 2019.
Data from non-OECD countries can vary from a two- to three-month lag (in the case of Brazil and India, for example) to a year or more. For this reason, EIA will have near-final data on about half of world oil consumption for 2020 by the first quarter of 2021, with values from the United States, OECD countries, and some non-OECD countries. EIA will add finalized data to its published estimates as information becomes available throughout 2021 and 2022.
The effects of the pandemic continue to present challenges in forecasting global petroleum liquids consumption. More context on these uncertainties is available in the STEO supplement Developments in Global Oil Consumption.
Principal contributor: Jeff Barron