
Monthly U.S. crude oil imports from OPEC fall to a 30-year low
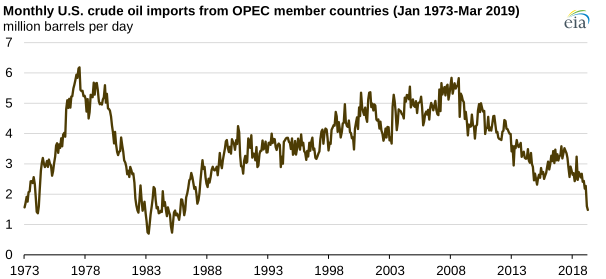
U.S. imports of crude oil from members of the Organization of the Petroleum Exporting Countries (OPEC) in March 2019 totaled 1.5 million barrels per day (b/d), their lowest level since March 1986, based on data in EIA’s Petroleum Supply Monthly. U.S. crude oil imports from OPEC members have generally fallen over the previous decade as domestic crude oil production has increased.
From the early 1980s through the late 2000s, OPEC member countries were the source of about half of all U.S. crude oil imports. In the past decade, however, total U.S. crude oil imports have fallen and OPEC’s share of those imports has decreased. Non-OPEC countries such as Canada, Mexico, Brazil, and Colombia have made up larger shares of U.S. crude oil imports. In each of the past four years, Canada alone has supplied more crude oil to the United States than all OPEC members combined.
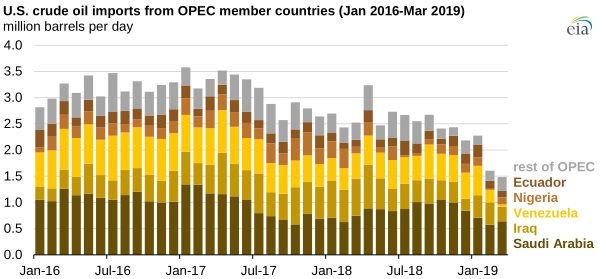
Through the first three months of 2019, U.S. crude oil imports from OPEC members Venezuela and Iraq have fallen the most. In 2018, Venezuela was the source of 505,000 b/d of U.S. crude oil imports, or 20% of the OPEC total. In March, the United States imported just 47,000 b/d of crude oil from Venezuela. Preliminary weekly import values show several weeks in March and May when the United States imported no crude oil from Venezuela.
U.S. sanctions directed at Venezuela's energy sector generally and Petróleos de Venezuela, S.A. specifically have driven U.S. imports from Venezuela to recent low levels. Before the United States imposed the sanctions, U.S. imports had been declining as long-term mismanagement of Venezuela’s oil industry, and widespread power outages since the beginning of this year have led to significant declines in Venezuelan crude oil production.
U.S. crude oil imports from other OPEC members also declined following a November 2016 agreement by OPEC members and a number of non-OPEC producers to cut crude oil production. As a result of the production cuts, many OPEC members reduced exports to the United States in favor of growing markets in Asia. In the first three months of 2019, the volume of U.S. crude oil imports from Saudi Arabia and Iraq—the two largest sources of imports from OPEC in 2018—have averaged 26% and 28% below their 2018 average levels.
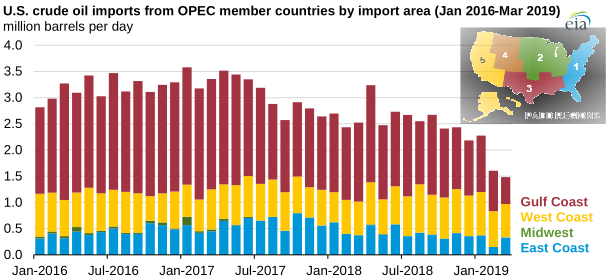
In 2018, the U.S. Gulf Coast region (defined as Petroleum Administration for Defense District 3) imported 1.4 million b/d of OPEC crude oil, or 55% of the national total of OPEC imports. With the recent decline, the U.S. Gulf Coast imported just 513,000 b/d from OPEC in March 2019. U.S. Gulf Coast imports of OPEC crude oil in March were below those for the West Coast region, marking the first time on record that the Gulf Coast region was not the predominant import area of OPEC crude oil in the United States.
For total crude oil imports, the Midwest (defined as Petroleum Administration for Defense District 2) has received more crude oil than the Gulf Coast in every month from November 2018 through March 2019, the latest available monthly value. Nearly all of the Midwest’s crude oil imports come from Canada.
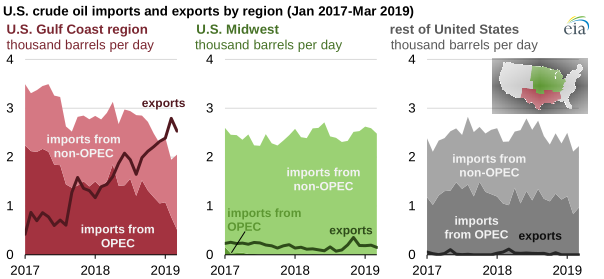
The decline in Gulf Coast crude oil imports and the recent rise in crude oil exports has led the Gulf Coast region to be a net exporter of crude oil in every month from November 2018 through March 2019. More than 90% of the U.S. crude oil exported since the start of 2018 has been shipped from Gulf Coast ports.
A recent This Week in Petroleum analysis provides more insight on recent changes and long-term trends in Gulf Coast crude oil supply.
Principal contributors: Owen Comstock, Mason Hamilton
Tags: OPEC, exports/imports, liquid fuels, crude oil, oil/petroleum