
U.S. natural gas processing plant capacity and throughput have increased in recent years
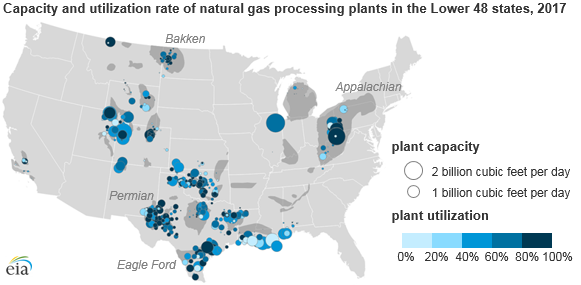
EIA estimates that between 2014 and 2017 natural gas processing capacity and processing throughput increased by about 5% on a net basis in the Lower 48 states, even as the number of individual plants declined. Natural gas processing plant utilization rates stayed constant at 66% from 2014 to 2017, but several states experienced significant changes, largely reflecting changes in natural gas production across regions.
Processing plants are midstream facilities that separate natural gas liquids (NGL) from natural gas. Some natural gas processing plants remove water and other contaminants from the raw natural gas stream and separate NGL streams into component products. EIA’s triennial EIA-757 Schedule A, Natural Gas Processing Plant Survey, tracks the country’s population of natural gas plants. EIA recently published 2017 data and an accompanying analysis that provide state-level summaries of total capacity, throughput, heat content, and utilization of all processing plants in the Lower 48 states. The accompanying analysis also compares this data with 2014 levels, the last time the survey data were collected.
As of the end of 2017, 510 active natural gas processing plants were active in the Lower 48 states with a total processing capacity of 80.8 billion cubic feet per day (Bcf/d). On average, these plants processed about 53.3 Bcf/d, operating at about 66% of capacity. Plants operate at less than full capacity for many reasons: transportation constraints, varying production volumes and characteristics, and regional economics.
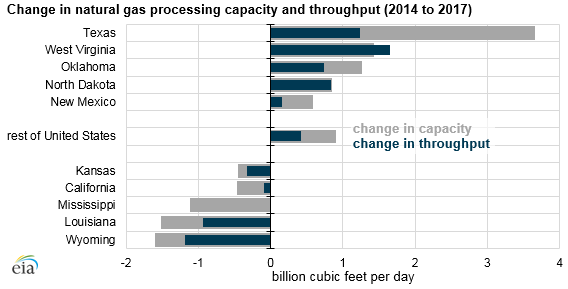
Regions with increased natural gas production, such as Texas (Permian, Eagle Ford), West Virginia (Marcellus, Utica), and North Dakota (Bakken), showed the largest increase in natural gas processing capacity and throughput between 2014 and 2017. In West Virgina, increases in the utilization of existing plants led to an increase in throughput from 2014 to 2017 that exceeded its increase in processing capacity.
At the national level, utilization rates remained essentially flat between 2014 and 2017, although some states showed more significant changes. In the Bakken region—Montana and North Dakota—both utilization rates and capacity increased, alongside increases in natural gas production. Similarly, Ohio and West Virginia, in the Appalachian Basin in the Northeast, also showed large increases in capacity and utilization.
However, in states such as Texas and Oklahoma, processing capacity grew more than throughput, resulting in slightly lower utilization in those states. Texas’s lower utilization rate may be partly attributed to the state’s natural gas production decline between 2014 and 2017.
Principal contributor: Michael Kopalek
Tags: natural gas, capacity, map