Wholesale power prices in 2017 were stable in the east, but increased in Texas, California
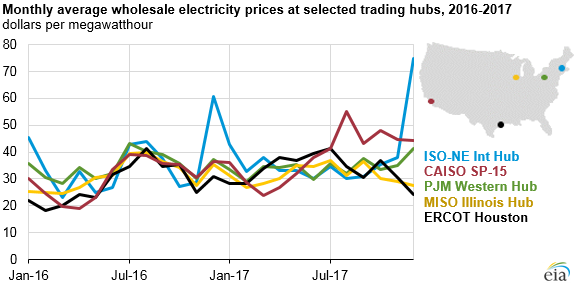
Wholesale electricity prices at major trading hubs in the eastern United States during 2017 were relatively unchanged from 2016, while average monthly wholesale prices in California and Texas increased by 18% and 27%, respectively, in 2017. Less volatility in natural gas fuel prices through the year contributed to stable wholesale electricity prices in most areas of the United States, although late summer heat waves resulted in short-term price spikes in some western electricity markets.
Average peak day-ahead wholesale electricity prices in regions controlled by the PJM Independent System Operator (ISO), which covers many parts of the Mid-Atlantic and Midwestern states, averaged about $34 per megawatthour (MWh) during 2017, 1% lower than in 2016. Although prices in ISO New England spiked to $75/MWh in December, the average annual wholesale price of $38/MWh in 2017 was just 7% higher than the 2016 average.
Hot summer temperatures in California led to periods of high electricity demand, which neared record hourly levels in the late summer. Wholesale prices during peak hours averaged $55/MWh in August, 42% higher than in the same month in 2016. On September 1, day-ahead electricity market prices in the California ISO were higher than $200/MWh for four hours and reached $770/MWh in one hour.
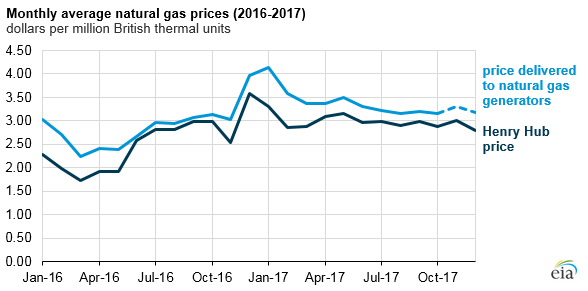
Electricity markets throughout the United States benefited from relatively low natural gas fuel costs. The monthly average price of natural gas delivered to U.S. electric generators peaked at $4.14 per million British thermal units (MMBtu) in January 2017, but during the second half of the year the average price stayed within a narrow range of $3.10/MMBtu to $3.30/MMBtu.
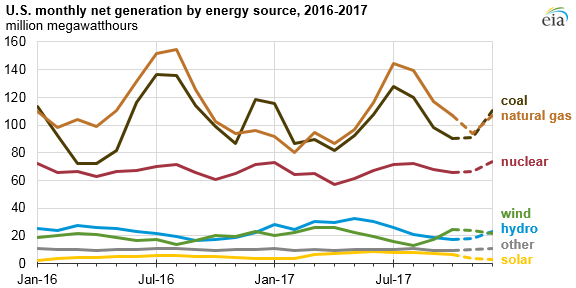
The continued low cost of natural gas also permitted it to remain the dominant source of U.S. power generation for the second year in a row. EIA estimates that natural gas-fired power plants supplied an average of 32% of total U.S. electricity in 2017, compared with 30% supplied by coal-fired power plants. The natural gas share of generation was down slightly from an average of 34% in 2016, as generation from renewable energy continued to grow.
Principal contributor: Tyler Hodge