
EIA forecasts mostly flat crude oil prices and increasing global production through 2019
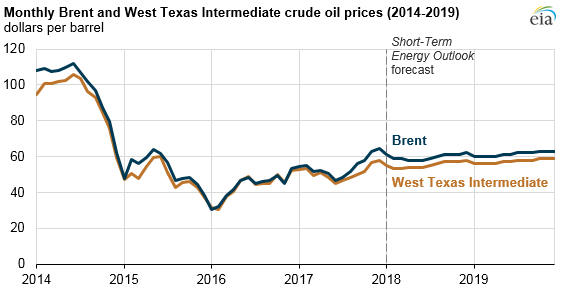
EIA’s January Short-Term Energy Outlook forecasts Brent crude oil to average $60 per barrel (b) in 2018 and $61/b in 2019, slightly higher than the $54/b average in 2017. In both 2018 and 2019, EIA expects total global crude oil production to be slightly greater than global consumption, with U.S. crude oil production increasing more than any other country.
Because crude oil prices are expected to be relatively flat through 2019, U.S. gasoline prices are also expected to remain near current levels. EIA forecasts the U.S. average regular retail gasoline price will average $2.57/gallon (gal) in 2018 and $2.58/gal in 2019, slightly higher than the $2.42/gal average in 2017.
EIA forecasts the West Texas Intermediate (WTI) crude oil spot price will average $55/b in 2018 and $57/b in 2019, or $4/b and $5/b, respectively, lower than Brent prices. This price difference is expected to narrow from the $6/b average price difference seen in the fourth quarter of 2017 because current constraints on the capacity to transport crude oil from the Cushing, Oklahoma storage hub (the geographic location associated with the WTI price) to the U.S. Gulf Coast are expected to gradually lessen.
As Asian demand for crude oil and petroleum products increase, supply considerations to transport crude oil to Asia are increasingly part of the price formation for global crude oil benchmarks. EIA estimates that, absent significant pipeline constraints, moving crude oil from Cushing, Oklahoma, to the U.S. Gulf Coast typically costs about $3.50/b. Moving that crude oil from the United States to Asia costs approximately $0.50/b more than to ship Brent from the North Sea to Asia. Although more crude oil export infrastructure has been recently built, U.S. exporters must still use smaller, less-economic vessels or more complex shipping arrangements, which often add to costs.
EIA estimates that the implied global stock change (the difference between total world consumption and total world production) averaged 0.4 million barrels per day (b/d) in 2017, marking the first year of global inventory draws since 2013. EIA expects global inventories to increase by about 0.2 million b/d in 2018 and by about 0.3 million b/d in 2019.
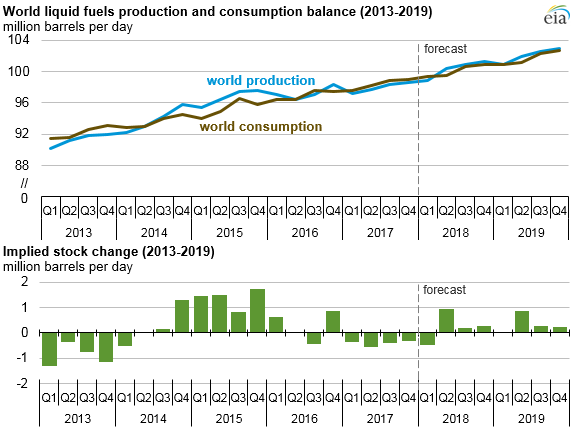
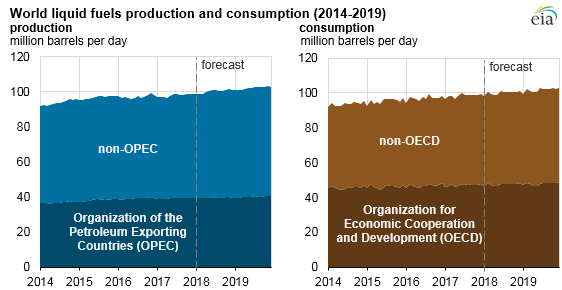
Crude oil production from the Organization of the Petroleum Exporting Countries (OPEC) averaged 32.5 million b/d in 2017, a decrease of 0.2 million b/d from 2016. The decline was mainly a result of the November 2016 OPEC production agreement that aimed to limit OPEC crude oil output to 32.5 million b/d. OPEC and non-OPEC participants agreed on November 30, 2017, to extend the production cuts through the end of 2018 in an effort to reduce global oil inventories. EIA expects OPEC crude oil production to increase by 0.2 million b/d in 2018 and by an additional 0.3 million b/d in 2019 as it slowly returns to pre-agreement levels.
Crude oil production from the United States is expected to increase more than in any other country. U.S. crude oil production is forecast to average 10.3 million b/d in 2018, marking the highest annual average production in U.S. history, surpassing the previous record of 9.6 million b/d set in 1970. U.S. crude oil production is expected to continue increasing in 2019 to an average of 10.8 million b/d.
Global consumption of petroleum and other liquid fuels grew by 1.4 million b/d in 2017, reaching an average of 98.4 million b/d for the year. EIA expects consumption growth will average 1.7 million b/d in 2018 and 1.6 million b/d in 2019, driven by the countries outside of the Organization for Economic Cooperation and Development (OECD). Non-OECD consumption growth is expected to account for 1.2 million b/d and 1.3 million b/d of the growth in 2018 and 2019, respectively.
Principal contributor: Matt French