
China leads the growth in projected global natural gas consumption
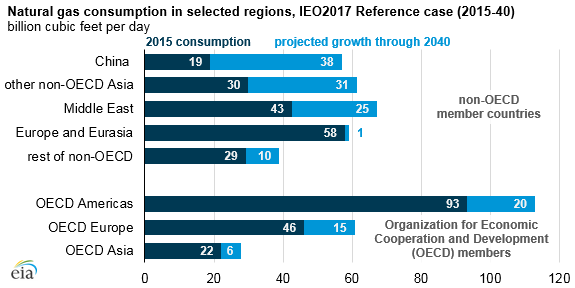
Global natural gas consumption is expected to grow from 340 billion cubic feet per day (Bcf/d) in 2015 to 485 Bcf/d by 2040, primarily in countries in Asia and in the Middle East, based on projections in EIA’s latest International Energy Outlook 2017 (IEO2017). China accounts for more than a quarter of all global natural gas consumption growth between 2015 and 2040.
The projected growth in natural gas consumption in China is driven by environmental policies, relative cost competiveness of natural gas in the industrial and transportation sectors, and relatively high economic growth.
China’s environmental policies are designed to reduce air pollution and carbon emissions by promoting natural gas in the country’s energy mix—replacing some coal and oil use with natural gas. In China’s 13th Five-Year Plan and the latest Energy Production and Consumption Revolution Strategy (2016-30), the Chinese government set targets to increase the share of natural gas in the primary energy mix from 5.9% in 2015 to 10% by 2020 and 15% by 2030.
EIA projects China’s natural gas consumption to grow from 19 Bcf/d in 2015 to 57 Bcf/d in 2040, surpassing all other countries except the United States. In the IEO2017 Reference case, U.S. natural gas consumption is projected to grow at a more modest rate, from 75 Bcf/d in 2015 to 88 Bcf/d in 2040, with the United States remaining the world’s largest natural gas consumer.
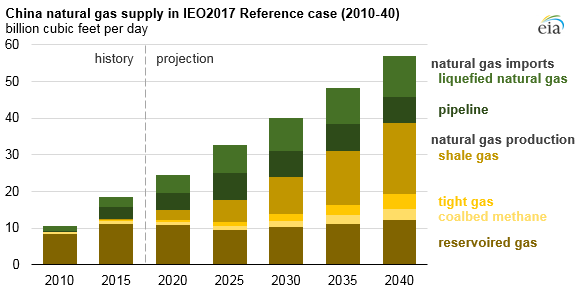
China’s domestic natural gas production reached 13 Bcf/d in 2016, accounting for 64% of China’s total natural gas supply. The IEO2017 Reference Case projects that China’s domestic natural gas production will reach 39 Bcf/d by 2040, driven primarily by the development of shale gas resources. EIA estimates that China holds the largest reserves of technically recoverable shale gas in the world, and China was among the first countries outside of North America to develop its shale resources.
The IEO2017 Reference case projects China’s shale gas production will grow from 0.7 Bcf/d in 2016 to 10 Bcf/d by 2030 and 19 Bcf/d by 2040, when shale gas is projected to account for a third of China’s total natural gas supply. China’s natural gas production from other sources, such as coalbed methane, tight formations, and more traditional natural gas reservoirs, is projected to increase more modestly, from 12 Bcf/d from these sources in 2016 to 20 Bcf/d by 2040.
Pipeline natural gas and liquefied natural gas (LNG) imports make up the rest of China’s supply, collectively accounting for 36% of the 2016 total and projected to account for 32% of the 2040 total. China’s LNG imports tripled between 2010 and 2016, reaching 3.5 Bcf/d (17% of total supply) in 2016. By 2018, China is projected to surpass South Korea as the world’s second-largest LNG importer. By 2040, China is expected to import about 11 Bcf/d, as much as the world’s largest LNG importer, Japan.
China’s pipeline imports increased to 3.7 Bcf/d in 2016, accounting for 19% of the total natural gas supply. Although the IEO2017 Reference Case expects China’s imports of natural gas by pipeline to rise in absolute terms to 7.3 Bcf/d in 2040, their share of China’s total supply is projected to fall to 12% by that year. China began importing natural gas by pipeline from Turkmenistan in 2010 and has since begun importing natural gas from Uzbekistan, Kazakhstan, and Myanmar. EIA expects natural gas imports from Russia on the new 3.7 Bcf/d Power of Siberia pipeline to begin in late 2019.
More information about international energy consumption and production is available in EIA’s International Energy Outlook 2017.
Principal contributor: Victoria Zaretskaya