U.S. refineries are running at record-high levels
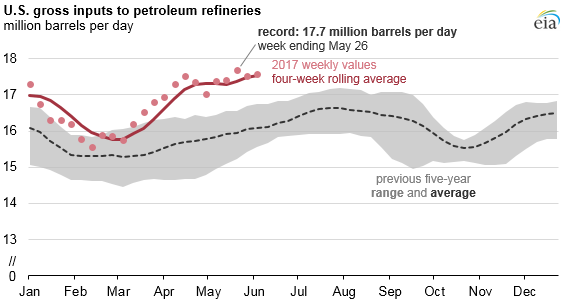
Note: Refinery gross inputs include crude oil and other oils processed through crude distillation units.
Gross inputs to U.S. petroleum refineries, also referred to as refinery runs, averaged a record high 17.7 million barrels per day (b/d) for the week ending May 26, before dropping slightly to 17.5 million b/d for the week ending June 2 and 17.6 million b/d for the week ending June 9. Product supplied to the U.S. market as well as inventories and exports are also at relatively high levels.
Weekly U.S. refinery runs have exceeded 17 million b/d only 24 times since EIA began publishing the data series in 1990, and all of those instances have occurred since July 2015. Despite record-high inputs, refinery utilization did not reach a new record, because refinery capacity has increased in recent years. Refinery utilization reached 95% for the week ending May 26, slightly lower than the levels reached in mid-July through mid-August 2015.
U.S. refinery capacity has increased by 659,000 barrels per calendar day (b/cd) since mid-August 2015. Refinery capacity—measured in barrels per calendar day (b/cd)—represents the amount of input that a crude oil distillation unit can process in a 24-hour period under usual operating conditions (averaged over the entire year), accounting for both planned and unplanned maintenance.
U.S. refineries have three primary outlets for their products: they can be placed in inventory, provided to end-users to satisfy domestic demand, or exported. Recently, petroleum product inventories, product supplied, and exports have all been higher than previous five-year averages.
Total product inventories for the first week of June 2017 were nearly 83 million barrels higher than the five-year average, although they are almost 3 million barrels lower than at the same time last year.
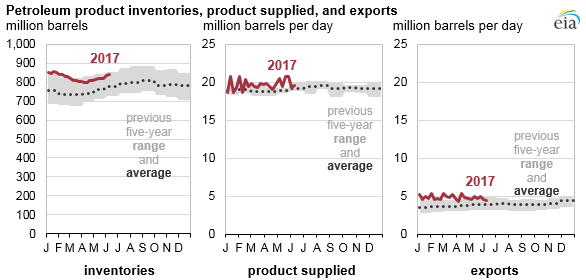
Note: Previous five-year values reflect monthly series, and 2017 values reflect weekly series.
Similarly, product supplied, a proxy for demand, was greater than the five-year average by nearly 600,000 b/d during the first week of June 2017 but 400,000 b/d lower than at the same time last year. Petroleum product exports were also higher than previous levels. EIA has been publishing weekly petroleum product exports based on near-real-time export data provided by U.S. Customs and Border Protection since August 31, 2016. Previously, weekly export estimates were developed from monthly official export data published by the U.S. Census Bureau, roughly six weeks following the end of each reporting month. Petroleum product exports for the first week of June 2017 were 831,000 b/d greater than the June 2016 average.
More information about weekly petroleum products is available through EIA’s Weekly Petroleum Status Report, released at 10:30 a.m. each Wednesday.
Principal contributors: Hannah Breul, Matthew French