
Quarterly coal production lowest since the early 1980s
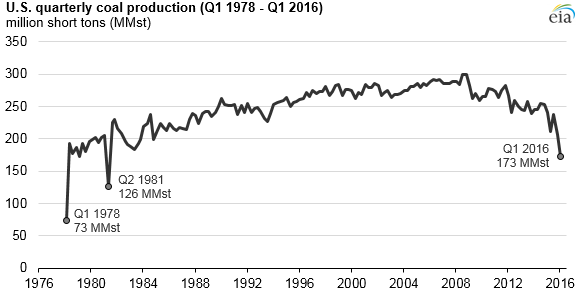
Coal production in the first three months of 2016 was 173 million short tons (MMst), the lowest quarterly level in the United States since a major coal strike in the second quarter of 1981. Among the supply regions, coal production from the Powder River Basin in Montana and Wyoming declined the most in tonnage and percentage since the previous quarter.
Coal production has declined because of increasingly challenging market conditions for coal producers. Electricity generation accounts for more than 90% of domestic coal use. In addition to complying with environmental regulations and adapting to slower growth in electricity demand, coal-fired generators also are competing with renewables and with natural gas-fired electricity generation during a time of historically low natural gas prices.
A 17% decrease in coal production from the previous quarter marked the largest quarter-over-quarter decline since the fourth quarter of 1984. Above-normal temperatures during the winter of 2015–16 were a key reason for the large decrease in coal production during the first three months of 2016. Throughout the fourth quarter of 2015, electric power plants received more coal than they consumed, leading to a net increase of 34 MMst in coal stockpiles, the highest fourth-quarter net increase on record.
High coal inventories encouraged electric power plants to consume coal from their stockpiles in the beginning of 2016, resulting in lower new coal orders. Decreases in coal purchases have reduced overall coal rail traffic because most producers ship coal by rail. Based on data from the American Association of Railroads, coal carloads in the first three months of 2016 were about 20% lower than in the final three months of 2015.
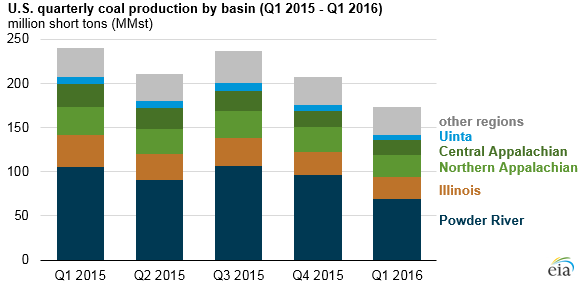
Regionally, production from the Powder River Basin (PRB) decreased the most between the fourth quarter of 2015 and the first quarter of 2016. First-quarter coal production of 69 MMst from the PRB was the lowest level since the second quarter of 1995.
The decline in coal demand is not limited to any geographic region. Texas, Michigan, Illinois, and Oklahoma accounted for an average quarterly demand of 37 MMst of PRB coal in 2015, or about 40% of the total PRB coal market. Demand for PRB coal in these four states fell to 19 MMst in the first quarter of 2016.
Principal contributor: Brian Park
Tags: coal, inventories/stocks, production/supply, rail