Few transportation fuels surpass the energy densities of gasoline and diesel
For the next two weeks (Dec. 23 - Jan. 3), Today in Energy will feature a selection of our favorite articles from 2013. Today's article was originally published on February 14.
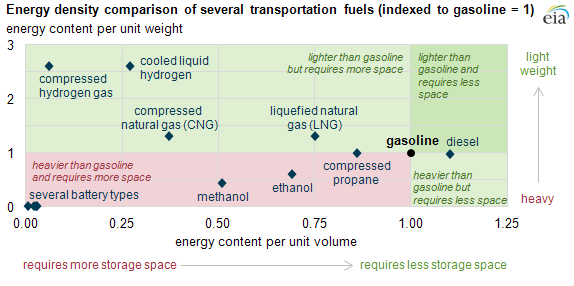
Energy density and the cost, weight, and size of onboard energy storage are important characteristics of fuels for transportation. Fuels that require large, heavy, or expensive storage can reduce the space available to convey people and freight, weigh down a vehicle (making it operate less efficiently), or make it too costly to operate, even after taking account of cheaper fuels. Compared to gasoline and diesel, other options may have more energy per unit weight, but none have more energy per unit volume.
On an equivalent energy basis, motor gasoline (which contains up to 10% ethanol) was estimated to account for 99% of light-duty vehicle fuel consumption in 2012. Over half of the remaining 1% was from diesel; all other fuels combined for less than half of 1%. The widespread use of these fuels is largely explained by their energy density and ease of onboard storage, as no other fuels provide more energy within a given unit of volume.
The chart above compares energy densities (both per unit volume and per unit weight) for several transportation fuels that are available throughout the United States. The data points represent the energy content per unit volume or weight of the fuels themselves, not including the storage tanks or other equipment that the fuels require. For instance, compressed fuels require heavy storage tanks, while cooled fuels require equipment to maintain low temperatures.
Beyond gasoline and diesel, other fuels like compressed propane, ethanol, and methanol offer energy densities per unit volume that are less than gasoline and diesel, and energy densities per unit weight that are less than or equal to that of gasoline. Natural gas, either in liquefied form (LNG) or compressed (CNG), are lighter than gasoline but again have lower densities per unit volume. The same is true for hydrogen fuels, which must be either cooled (down to -253oC) or compressed (to 3,000 to 10,000 psi).
However, considering only energy density leaves out the relative fuel economies associated with vehicles capable of using other fuels. The typical fuel economy of an internal combustion engine in a light-duty vehicle is around 25 miles per gallon. On an equivalent basis, electric vehicles with fuel cells powered by hydrogen can double the fuel economy of a similarly sized gasoline vehicle, while battery-powered electric vehicles can achieve a quadrupling of fuel economy, but the costs of fuel cells, hydrogen storage, and batteries are prohibitively expensive to most consumers and the availability of refueling and charging facilities is extremely limited. In addition, the improvement in fuel economy of these vehicles does not compensate for the lower fuel densities of hydrogen and various battery types like lithium ion, lithium polymer, and nickel-metal hydride batteries that result in limited driving range relative to gasoline-powered vehicles.
Tags: alternative fuels, diesel, gasoline, transportation, vehicles