
Price difference between Brent and WTI crude oil narrowing
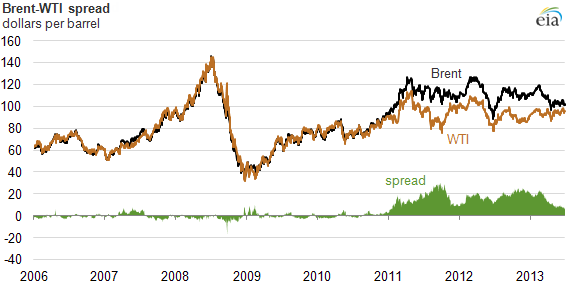
The Brent-WTI spread, the difference between the prices of Brent and West Texas Intermediate (WTI) crude oils, has narrowed considerably over the past several months. The spread, which was more than $23 per barrel ($/bbl) in mid-February, fell to under $9/bbl in April, and has ranged between $6/bbl and $10/bbl since then.
The narrowing of the spread is supported by several factors that have:
- Lowered Brent (North Sea) prices because Brent-quality crude imports into North America have been displaced by increased U.S. light sweet crude production, reducing Brent-quality crude demand
- Raised WTI (Cushing, Oklahoma) prices because the infrastructure limitations that had lowered WTI prices are lessening
Before 2011, Brent and WTI crude oil prices tracked closely, with Brent crude oil prices typically trading at a slight discount to WTI crude oil, reflecting delivery costs to transport Brent crude oil and Brent-like crude oil into the U.S. market, where they competed with WTI crude oil. In early 2011, this longstanding relationship began to change, and since then, WTI crude oil has priced at a persistent discount to Brent crude oil. Increased U.S. light sweet crude oil production combined with limited pipeline capacity to move the crude from production fields and storage locations, including Cushing, Oklahoma, the delivery point for the Nymex light sweet crude oil contract, to refining centers put downward pressure on the price of WTI crude oil.
More recently, expansions in U.S. crude oil infrastructure have eased the downward pressure on the price of WTI. Since mid-2012, significant pipeline takeaway capacity has been added at Cushing, enabling crude oil to flow to and from the trading hub more easily. Other pipeline and rail projects have also been completed, making it possible to move barrels from production areas, such as Texas and North Dakota, to refinery centers without passing through the hub. Even U.S. East Coast refineries, which historically have relied on Brent crude oil and Brent-like crudes, can now access U.S. light sweet crude oil. U.S. crude that moves by rail is replacing Brent crude oil and Brent-like crude oil imports into the U.S. East Coast, putting downward pressure on the price of Brent crude oil and narrowing the differential versus WTI crude oil.
The future of the Brent-WTI price spread will be determined, in part, by the balance between future growth in U.S. crude production and the capacity of crude oil infrastructure to move that crude to U.S. refiners. The International Energy Agency (IEA) reported that planned maintenance in the North Sea oil fields this summer will reduce production, adding upward pressure to Brent prices and potentially widening the Brent-WTI spread. In its June 2013 Short-Term Energy Outlook, EIA forecast the Brent-WTI price spread to average $11/bbl in 2013 and decline to an average $8/bbl in 2014. For more information about the Brent-WTI spread, see the June 5, 2013, edition of This Week in Petroleum.