
Six U.S. states accounted for over half of the primary energy produced in 2019
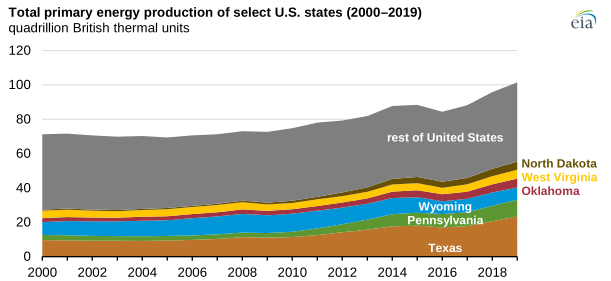
In 2019, the top six primary energy-producing states—Texas, Pennsylvania, Wyoming, Oklahoma, West Virginia, and North Dakota—accounted for 55 quadrillion British thermal units (quads), or 55% of all of the primary energy produced in the United States. In 2000, these six states had accounted for 39% of the nation’s primary energy production, indicating that primary energy production has become more concentrated to the top producing states.
Primary energy production in the United States grew 40% from 2009 to 2019, driven largely by increased crude oil and natural gas production in Texas, Pennsylvania, Oklahoma, and North Dakota. During that period, advances in hydraulic fracturing and horizontal drilling made drilling for previously inaccessible crude oil and natural gas more economical in the United States. Between 2009 and 2019, production of primary energy more than doubled in Texas and Oklahoma, more than tripled in Pennsylvania, and more than quadrupled in North Dakota.
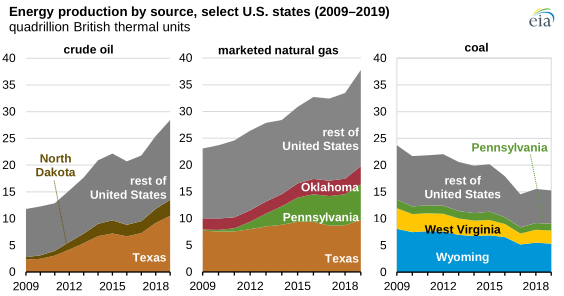
Texas has led the nation in both crude oil and natural gas production since 1988, when it surpassed Alaska as the top crude oil-producing state. In 2019, Texas accounted for 41% of U.S. crude oil production, double its 2009 share. North Dakota, the second-largest crude oil-producing state in 2019, accounted for 12% of U.S. oil production, up from 3% of the U.S. total in 2009.
Marketed production of natural gas grew 76% in the United States between 2009 and 2019. Texas, Pennsylvania, and Oklahoma accounted for 53% of the nation’s natural gas production in 2019. The most notable increase over this time period occurred in Pennsylvania, which produced 0.2 quads of natural gas in 2009 compared with 6.6 quads of natural gas in 2019.
U.S. coal production has declined since the mid-2000s because of falling coal demand for electricity generation. Given changing market dynamics, we now forecast that coal production will actually grow in 2021. The top three coal-producing states (Wyoming, West Virginia, and Pennsylvania) accounted for 57% of total production in 2009 and 59% in 2019.
Production of renewable energy in the United States, which includes sources such as hydroelectricity, wind, solar, and biofuels, has grown by 51% since 2009. Texas produced more than three times as much renewable energy in 2019 than in 2009, driven by increases in biofuels energy production and electricity generation from wind. Of the 50 states, only Washington and West Virginia produced less renewable energy in 2019 than in 2009.
The share of energy produced in nuclear reactors did not change much in the United States between 2009 and 2019, growing by 1%.
Principal contributor: Brett Marohl