Electricity Monthly Update
Highlights: December 2025
-
The Northeast saw a 9.6% increase in net electricity generation compared to the previous December, as this part of the country saw below average temperatures that led to increased electricity demand during December 2025.
-
Southern Company saw its daily peak electricity demand range from its lowest over the twelve month period to around ninety percent of its all-time peak demand.
-
Total U.S. coal stockpiles decreased by 2.1% to 109 million tons compared to the previous month.
Key indicators
End Use: December 2025
Retail rates/prices and consumption
In this section, we look at what electricity costs and how much is purchased. Charges for retail electric service are based primarily on rates approved by state regulators. However, a number of states have allowed retail marketers to compete to serve customers and these competitive retail suppliers offer electricity at a market-based price.
EIA does not directly collect retail electricity rates or prices. However, using data collected on retail sales revenues and volumes, we calculate average retail revenues per kWh as a proxy for retail rates and prices. Retail sales volumes are presented as a proxy for end-use electricity consumption.
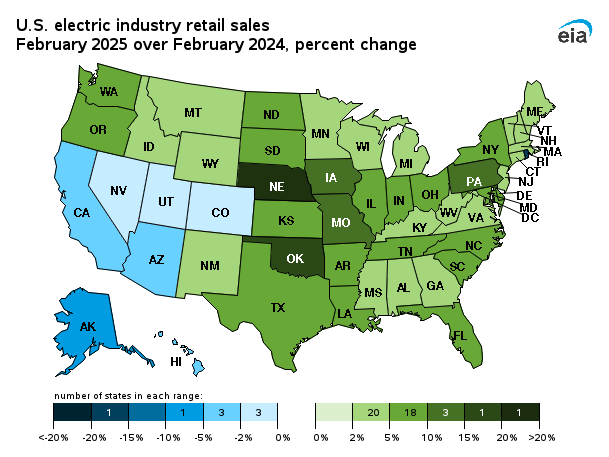
Average revenue per kWh by state
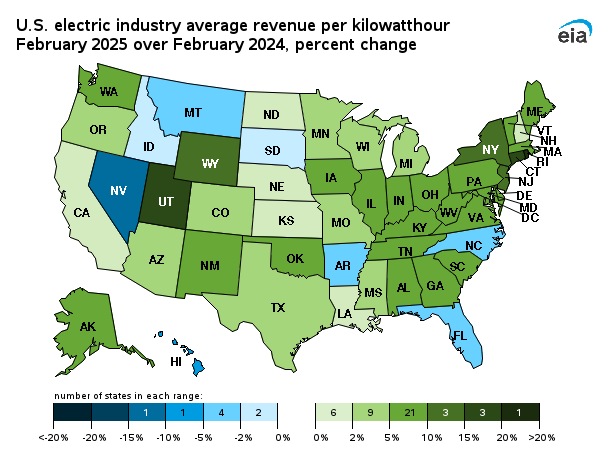
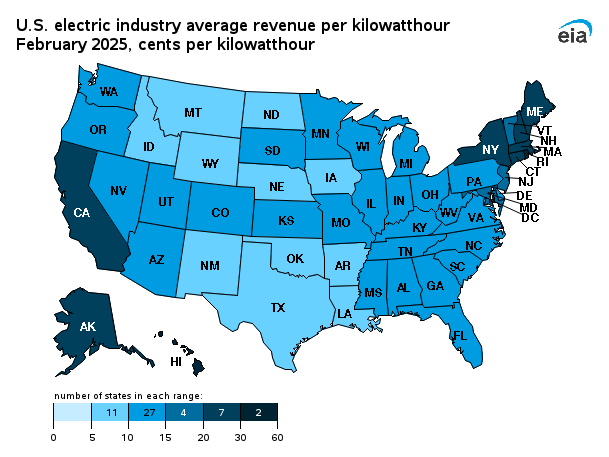
Forty-four states and the District of Columbia saw increased revenue per kilowatt-hour (kWh) compared to last December, while average revenue per kWh increased by 7.1% on a national basis. The largest percent increase was in the District of Columbia, up 26.3%, followed by Pennsylvania, up 18.9%, and Rhode Island, up 16.3%. Average revenue per kWh figures decreased in five states compared to last year. The largest percent decrease was in Nevada, down 7.7%, followed by Connecticut, down 7.6%, and New Mexico, down 2.9%. In the contiguous US, California, Rhode Island, and Massachusetts had the highest average revenues at 28.18, 28.01, and 26.72 cents per kWh, respectively. North Dakota, New Mexico, and Iowa had the lowest average revenues at 8.12, 8.69, and 8.94 cents per kWh, respectively.
| Average Revenues/Sales (¢/kWh) | Retail Sales (thousand MWh) | |||||||||||||||||||||||||||||||||||||||||||||||||||||||||||||||||||||||||||||||||||||||||||||||||
|---|---|---|---|---|---|---|---|---|---|---|---|---|---|---|---|---|---|---|---|---|---|---|---|---|---|---|---|---|---|---|---|---|---|---|---|---|---|---|---|---|---|---|---|---|---|---|---|---|---|---|---|---|---|---|---|---|---|---|---|---|---|---|---|---|---|---|---|---|---|---|---|---|---|---|---|---|---|---|---|---|---|---|---|---|---|---|---|---|---|---|---|---|---|---|---|---|---|---|
| End-use sector | December 2025 | Change fromDecember 2024 | December 2025 | Change fromDecember 2024 | Year to Date | |||||||||||||||||||||||||||||||||||||||||||||||||||||||||||||||||||||||||||||||||||||||||||||
| Residential | 17.24 | 6.0% | 129,667 | 3.3% | 1,514,993 | |||||||||||||||||||||||||||||||||||||||||||||||||||||||||||||||||||||||||||||||||||||||||||||
| Commercial | 13.63 | 7.8% | 122,522 | 4.6% | 1,493,486 | |||||||||||||||||||||||||||||||||||||||||||||||||||||||||||||||||||||||||||||||||||||||||||||
| Industrial | 8.53 | 7.2% | 84,907 | -0.0% | 1,042,217 | |||||||||||||||||||||||||||||||||||||||||||||||||||||||||||||||||||||||||||||||||||||||||||||
| Transportation | 14.04 | 4.9% | 621 | 2.6% | 7,311 | |||||||||||||||||||||||||||||||||||||||||||||||||||||||||||||||||||||||||||||||||||||||||||||
| Total | 13.73 | 7.1% | 337,716 | 2.9% | 4,058,007 | |||||||||||||||||||||||||||||||||||||||||||||||||||||||||||||||||||||||||||||||||||||||||||||
| Source: U.S. Energy Information Administration | ||||||||||||||||||||||||||||||||||||||||||||||||||||||||||||||||||||||||||||||||||||||||||||||||||
Total average revenues per kilowatt-hour (kWh) increased by 7.1% from last December, to 13.73 cents/kWh in December 2025. All four sectors saw increases in average revenues per kWh compared to last December. The Commercial sector saw the highest increase, up 7.8%, then the Industrial sector, up 7.2%, the Residential sector, up 6.0%, and finally the Transportation sector, up 4.9%. On a nationwide basis, retail sales increased by 2.9% in December 2025 compared to last December, with three sectors seeing increases. The Commercial sector saw the largest increase in retail sales from last December, up 4.6%, followed by the Residential sector, up 3.3%, and the Transportation sector, up 2.6%. The Industrial sector remained unchanged.
Retail sales
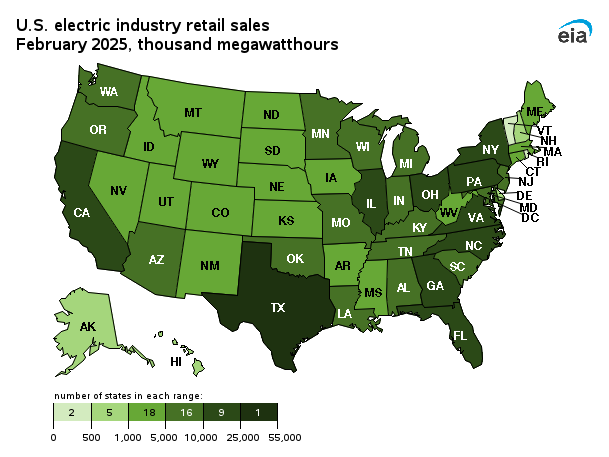
Forty-three states and the District of Columbia saw an increase in retail sales volume in December 2025 compared to last December. Rhode Island had the highest year over year percent increase in retail sales, up 15.6%, followed by Ohio, up 9.9%, and Nebraska, up 9.4%. Seven states saw a decrease in retail sales volume compared to last year. California had the highest year over year percent decrease, down 7.4%, followed by Idaho, down 3.6%, and Washington down 2.3%.
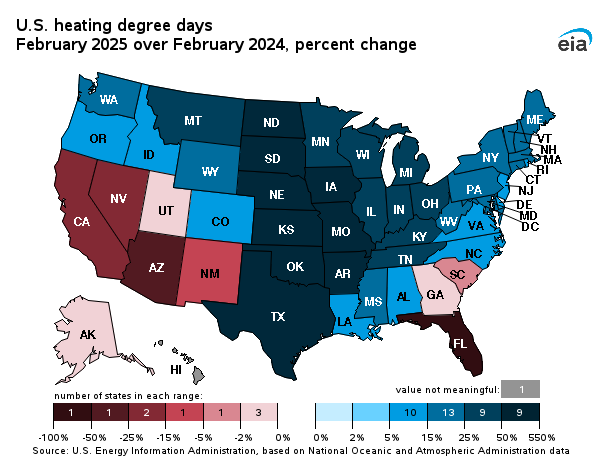
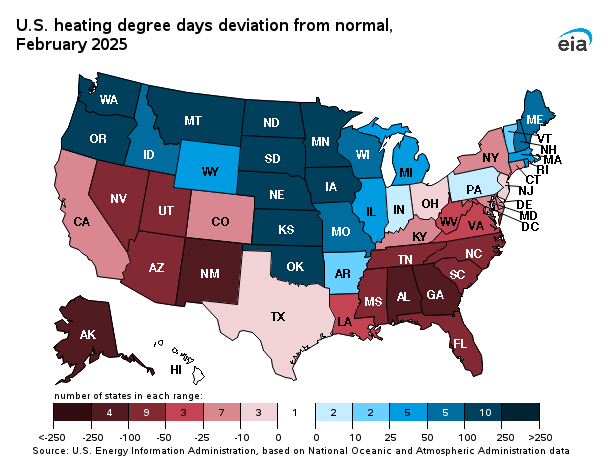
Thirty-five states and the District of Columbia saw an increase in HDDs compared to last December. Alaska had the highest year over year percent increase, up 33%, followed by the District of Columbia, up 20%, and Texas up 19%. Fourteen states saw a decrease in HDDs from last December. Florida had the highest percentage year over year decrease, down 17%, followed by Utah, down 16%, and Nevada, down 14%.
Resource Use: December 2025
Supply and fuel consumption
In this section, we look at the resources used to produce electricity. Generating units are chosen to run primarily on their operating costs, of which fuel costs account for the lion's share. Therefore, we present below, electricity generation output by fuel type and generator type. Since the generator/fuel mix of utilities varies significantly by region, we also present generation output by region.
Generation output by region
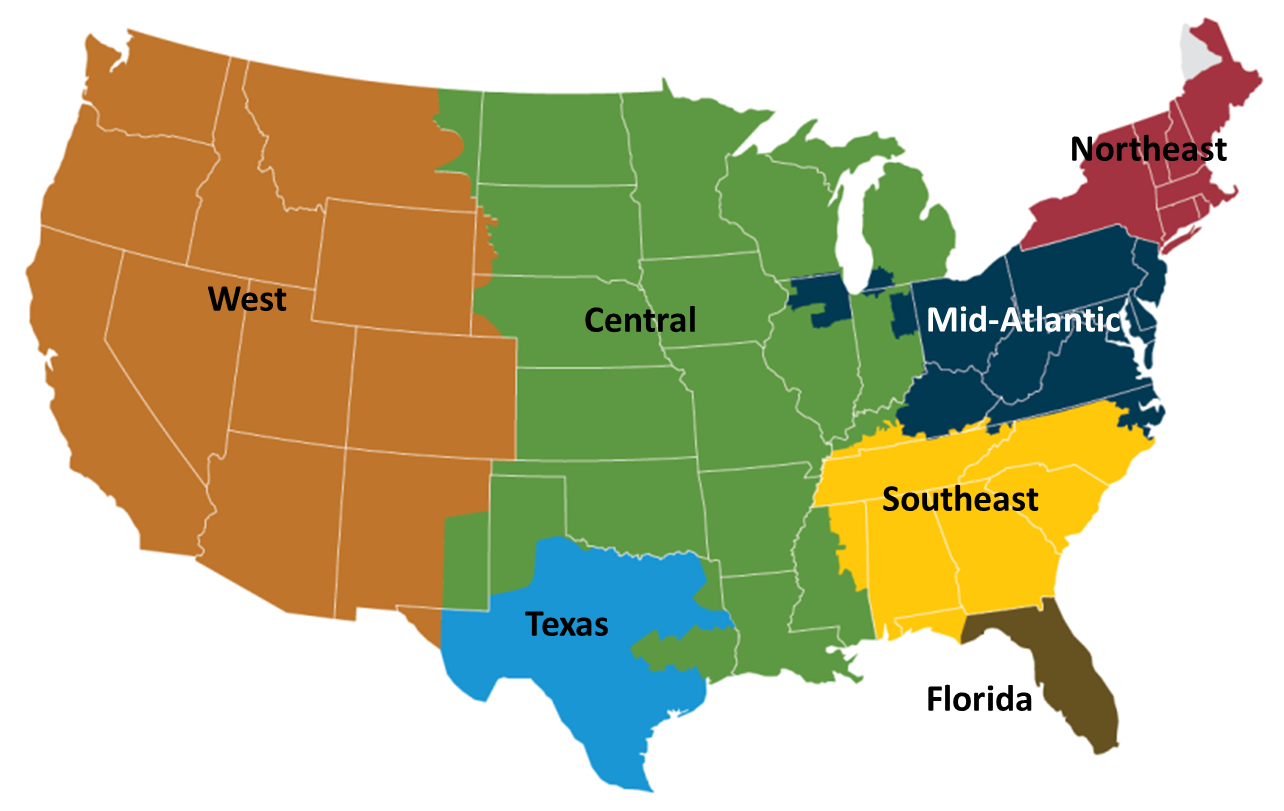
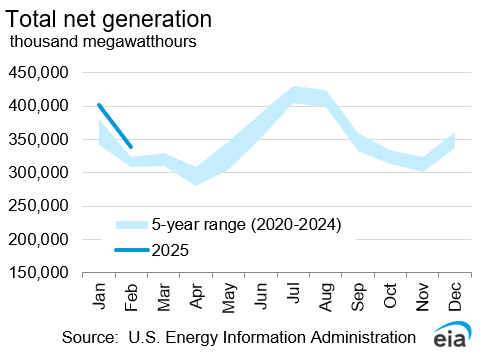
Net electricity generation in the United States increased 5.8% compared to December 2024. All areas of the country saw an increase in electricity generation compared to the previous December. The Northeast saw the largest year-over-year increase, up 9.6%, as this part of the country saw below average temperatures in December 2025 after experiencing slightly above average temperatures in December 2024. This led to a significant increase in residential heating this December compared to last year, which led to a significant increase in electricity demand.
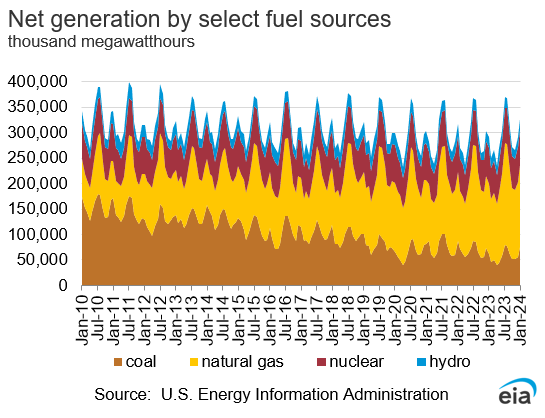
The change in coal generation from the previous December was mixed throughout the country, with the MidAtlantic, Central, Southeast, and Florida all seeing a year-over-year increase in coal generation, while the Northeast, West, and Texas all saw a decrease in coal generation compared to December 2024. Most parts of the country, except for the Central and Western regions, saw an increase in natural gas generation compared to the previous year. Electricity generation from nuclear increased 1.9% compared to December 2024, while electricity generation from other renewables had a year-over-year increase in all regions, except the Southeast, when compared to the previous December.
Fossil fuel consumption by region
The chart above compares coal consumption in December 2024 and December 2025 by region and the second tab compares natural gas consumption by region over the same period. Changes in coal and natural gas consumption were similar to their respective changes in coal and natural gas generation.
The third tab presents the change in the relative share of fossil fuel consumption by fuel type on a percentage basis, calculated using equivalent energy content (Btu). This highlights changes in the relative market shares of coal, natural gas, and petroleum. The MidAtlantic, Central, Southeast, and Florida all saw their shares of coal increase at the expense of natural gas, while the West and Texas all saw their share of natural gas increase at the expense of coal. The Northeast saw other fossil fuels consumption increase at the expense of natural gas in December 2025. This occurred because the Northeast experienced below normal temperatures in December 2025 and the region has the propensity to dispatch oil-fueled generators when electricity demand gets high in the winter months.
The fourth tab presents the change in coal and natural gas consumption on an energy content basis by region. The changes in total coal and natural gas consumption were similar to the changes seen in total coal and natural gas net generation in each region.
Fossil fuel prices
November 2025 and December 2025 average fossil fuel spot prices were not available when the February 2026 Electricity Monthly Update was published.
Regional Wholesale Markets: December 2025
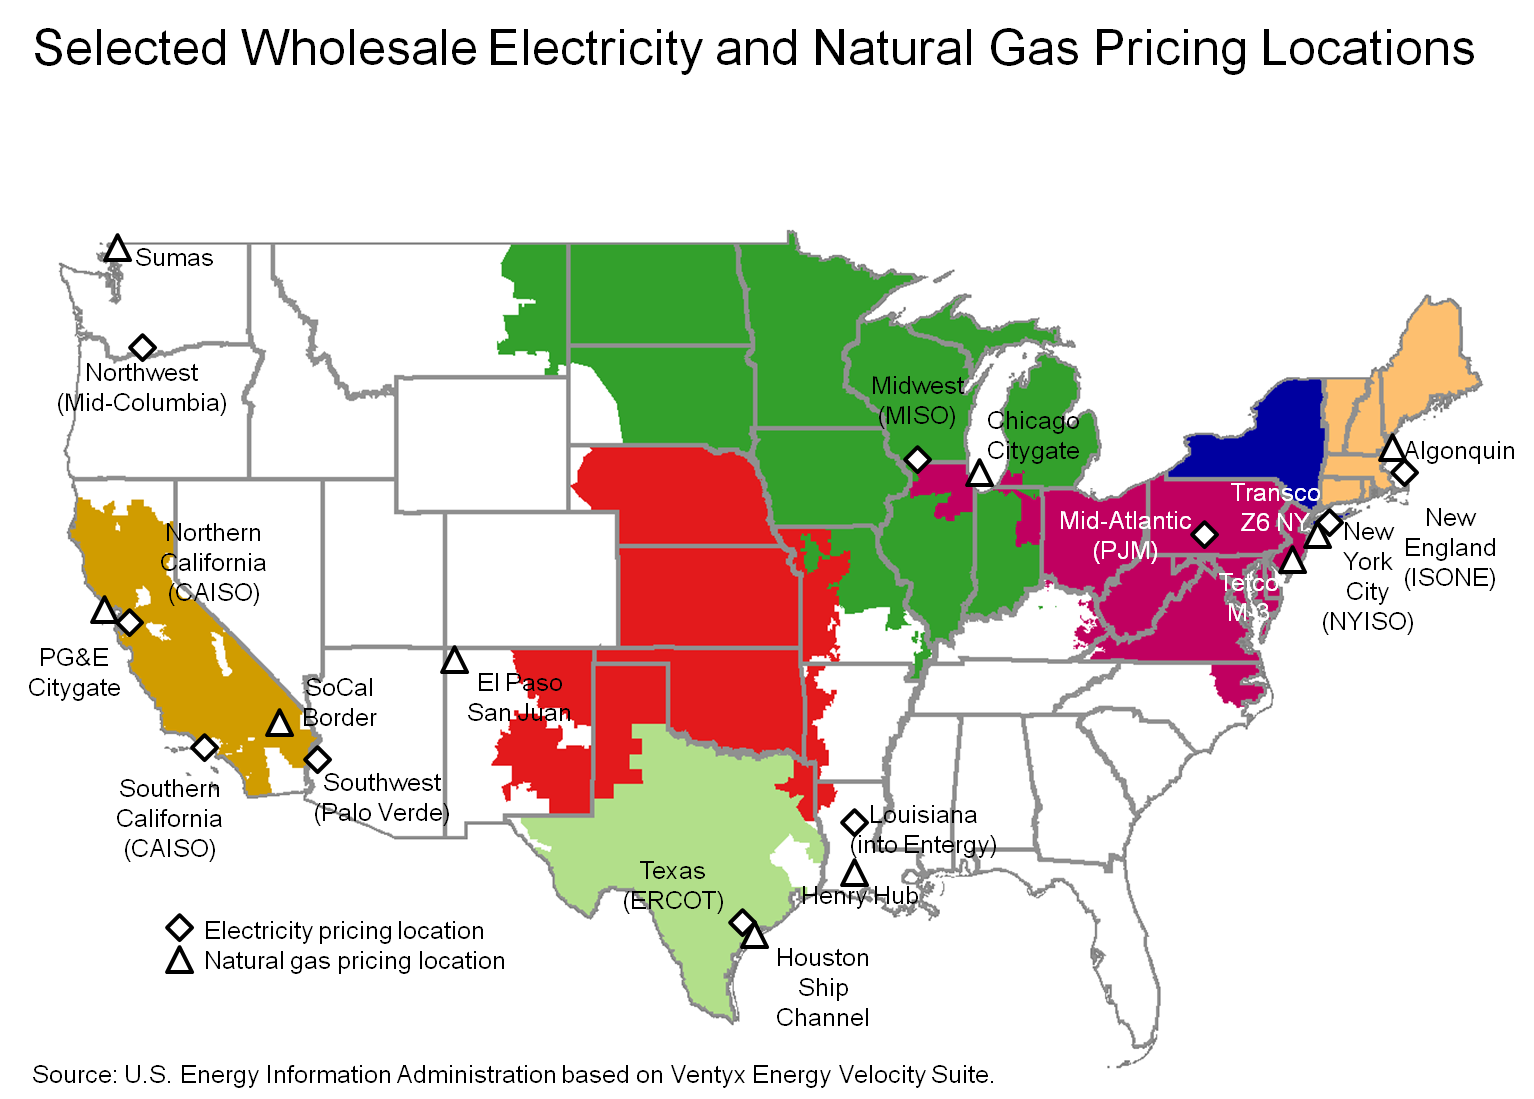
The United States has many regional wholesale electricity markets. Below we look at monthly and annual ranges of on-peak, daily wholesale prices at selected pricing locations and daily peak demand for selected electricity systems in the Nation. The range of daily prices and demand data is shown for the report month and for the year ending with the report month.
Prices and demand are shown for six Regional Transmission Operator (RTO) markets: ISO New England (ISO-NE), New York ISO (NYISO), PJM Interconnection (PJM), Midwest ISO (MISO), Electric Reliability Council of Texas (ERCOT), and two locations in the California ISO (CAISO). Also shown are wholesale prices at trading hubs in Louisiana (into Entergy), Southwest (Palo Verde) and Northwest (Mid-Columbia). In addition to the RTO systems, peak demand is also shown for the Southern Company, Progress Florida, and the Bonneville Power Authority (BPA). Refer to the map tabs for the locations of the electricity and natural gas pricing hubs and the electric systems for which peak demand ranges are shown.
In the second tab immediately below, we show monthly and annual ranges of on-peak, daily wholesale natural gas prices at selected pricing locations in the United States. The range of daily natural gas prices is shown for the same month and year as the electricity price range chart. Wholesale electricity prices are closely tied to wholesale natural gas prices in all but the center of the country. Therefore, one can often explain current wholesale electricity prices by looking at what is happening with natural gas prices.
Wholesale prices


Electricity system daily peak demand
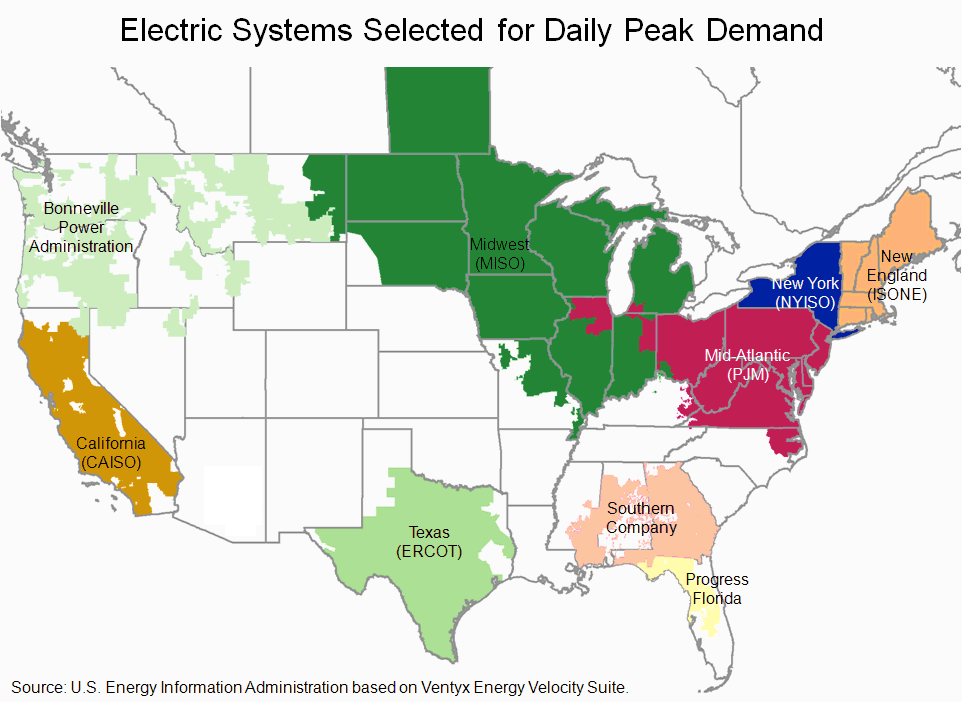
In December 2025, most electricity systems across the country saw their daily peak electricity demand in the middle to low ends of their annual range ending December 2025. Southern Company, in particular, saw its daily peak electricity demand range from its lowest over the twelve month period to around ninety percent of all-time peak demand.
Electric Power Sector Coal Stocks: December 2025
Total U.S. coal stockpiles decreased by 2.1% to 109 million tons compared to the previous month. This month-over-month decrease in coal stockpiles is normal as the country enters the winter months and coal power plants begin to draw down their stockpiles to meet winter electricity demand.
Days of burn
The average number of days of burn held at electric power plants is a forward-looking estimate of coal supply given a power plant's current stockpile and past consumption patterns. For bituminous units largely located in the eastern United States, the average number of days of burn increased from the previous month, going from 123 days of forward-looking days of burn in November 2025 to 131 days of burn in December 2025. For subbituminous units largely located in the western United States, the average number of days of burn also increased, going from 120 days of burn in November 2025 to 140 days of burn in December 2025.
Coal stocks and average number of days of burn for non-lignite coal by region (electric power sector)
| December 2025 | December 2024 | November 2025 | ||||||||||||||||||||||||||||||||||||||||||||||||||||||||||||||||||||||||||||||||||||||||||||||||
|---|---|---|---|---|---|---|---|---|---|---|---|---|---|---|---|---|---|---|---|---|---|---|---|---|---|---|---|---|---|---|---|---|---|---|---|---|---|---|---|---|---|---|---|---|---|---|---|---|---|---|---|---|---|---|---|---|---|---|---|---|---|---|---|---|---|---|---|---|---|---|---|---|---|---|---|---|---|---|---|---|---|---|---|---|---|---|---|---|---|---|---|---|---|---|---|---|---|---|
| Zone | Coal | Stocks (1000 tons) | Days of Burn | Stocks (1000 tons) | Days of Burn | % Change of Stocks | Stocks (1000 tons) | Days of Burn | % Change of Stocks | |||||||||||||||||||||||||||||||||||||||||||||||||||||||||||||||||||||||||||||||||||||||||
| Northeast | Bituminous | 1,727 | 187 | 1,847 | 145 | -6.5% | 2,026 | 178 | -14.8% | |||||||||||||||||||||||||||||||||||||||||||||||||||||||||||||||||||||||||||||||||||||||||
| Subbituminous | . | . | . | . | . | . | . | . | ||||||||||||||||||||||||||||||||||||||||||||||||||||||||||||||||||||||||||||||||||||||||||
| South | Bituminous | 19,497 | 139 | 19,344 | 140 | 0.8% | 19,787 | 135 | -1.5% | |||||||||||||||||||||||||||||||||||||||||||||||||||||||||||||||||||||||||||||||||||||||||
| Subbituminous | 5,495 | 92 | 6,145 | 101 | -10.6% | 5,340 | 81 | 2.9% | ||||||||||||||||||||||||||||||||||||||||||||||||||||||||||||||||||||||||||||||||||||||||||
| Midwest | Bituminous | 9,453 | 106 | 11,846 | 146 | -20.2% | 9,713 | 99 | -2.7% | |||||||||||||||||||||||||||||||||||||||||||||||||||||||||||||||||||||||||||||||||||||||||
| Subbituminous | 27,627 | 123 | 32,647 | 156 | -15.4% | 25,748 | 92 | 7.3% | ||||||||||||||||||||||||||||||||||||||||||||||||||||||||||||||||||||||||||||||||||||||||||
| West | Bituminous | 1,927 | 151 | 2,928 | 206 | -34.2% | 2,012 | 134 | -4.2% | |||||||||||||||||||||||||||||||||||||||||||||||||||||||||||||||||||||||||||||||||||||||||
| Subbituminous | 28,641 | 170 | 31,972 | 177 | -10.4% | 29,034 | 171 | -1.4% | ||||||||||||||||||||||||||||||||||||||||||||||||||||||||||||||||||||||||||||||||||||||||||
| U.S. Total | Bituminous | 32,604 | 131 | 35,965 | 147 | -9.3% | 33,537 | 123 | -2.8% | |||||||||||||||||||||||||||||||||||||||||||||||||||||||||||||||||||||||||||||||||||||||||
| Subbituminous | 61,763 | 140 | 70,763 | 159 | -12.7% | 60,123 | 120 | 2.7% | ||||||||||||||||||||||||||||||||||||||||||||||||||||||||||||||||||||||||||||||||||||||||||
|
Source: U.S. Energy Information Administration NOTE: Stockpile levels shown above reflect a sample of electric power sector plants, which were used to create the days of burn statistics. These levels will not equal total electric power sector stockpile levels. |
||||||||||||||||||||||||||||||||||||||||||||||||||||||||||||||||||||||||||||||||||||||||||||||||||
Methodology and Documentation
General
The Electricity Monthly Update is prepared by the Electric Power Operations Team, Office of Electricity, Renewables and Uranium Statistics, U.S. Energy Information Administration (EIA), U.S. Department of Energy. Data published in the Electricity Monthly Update are compiled from the following sources: U.S. Energy Information Administration, Form EIA-826,"Monthly Electric Utility Sales and Revenues with State Distributions Report," U.S. Energy Information Administration, Form EIA-923, "Power Plant Operations Report," fuel spot prices from Bloomberg Energy, electric power prices from SNL Energy, electric system demand data from Ventyx Energy Velocity Suite, and weather data and imagery from the National Oceanic and Atmospheric Administration.
The survey data are collected monthly using multiple-attribute cutoff sampling of power plants and electric retailers for the purpose of estimation for various data elements (generation, stocks, revenue, etc.) for various categories, such as geographic regions. (The data elements and categories are "attributes.") The nominal sample sizes are: for the Form EIA-826, approximately 450 electric utilities and other energy service providers; for the Form EIA-923, approximately 1900 plants. Regression-based (i.e., "prediction") methodologies are used to estimate totals from the sample. Essentially complete samples are collected for the Electric Power Monthly (EPM), which includes State-level values. The Electricity Monthly Update is based on an incomplete sample and includes only regional estimates and ranges for state values where applicable. Using "prediction," it is generally possible to make estimates based on the incomplete EPM sample, and still estimate variances.
For complete documentation on EIA monthly electric data collection and estimation, see the Technical Notes PDF to the Electric Power Monthly. Values displayed in the Electric Monthly Update may differ from values published in the Electric Power Monthly due to the additional data collection and data revisions that may occur between the releases of these two publications.
Accessing the data: The data included in most graphics can be downloaded via the "Download the data" icon above the navigation pane.Some missing data are proprietary and non-public.
For a guide that describes electricity data that EIA collects and how the data are made available to the public, see the Guide to EIA Electric Power Data.
Key Indicators
The Key Indicators in the table located in the "Highlights" section, are defined below. The current month column includes data for the current month at a national level. The units vary by statistic, but are included in the table. The "% Change from 2010" value is the current month divided by the corresponding month last year (e.g. July 2011 divided by July 2010). This is true for Total Generation, Residential Retail Price, Retail Sales, Degree-Days, Coal Stocks, Coal and Natural Gas Consumption. The Henry Hub current month value is the average weekday price for the current month. The Henry Hub "% Change from 2010" value is the average weekday price of the same month from 2010 divided by the average weekday price of the current month.
- Total Net Generation: Reflects the total electric net generation for all reporting sectors as collected via the Form EIA-923.
- Residential Retail Price: Reflects the average retail price as collected via the Form EIA-826.
- Retail Sales: Reflects the reported volume of electricity delivered as collected via the Form EIA-826.
- Degree-Days: Reflects the total population-weighted United States degree-days as reported by the National Oceanic and Atmospheric Administration.
- Natural Gas Henry Hub: Reflects the average price of natural gas at Henry Hub for the month. The data are provided by Bloomberg.
- Coal Stocks: Reflects the total coal stocks for the Electric Power Sector as collected via the Form EIA-923.
- Coal Consumption: Reflects the total coal consumption as collected via the Form EIA-923.
- Natural Gas Consumption: Reflects the total natural gas consumption as collected via the Form EIA-923.
- Nuclear Outages: Reflects the average daily outage amount for the month as reported by the Nuclear Regulatory Commission's Power Reactor Status Report and the latest net summer capacity data collected on the EIA-860 Annual Generator Report.
Sector Definitions
The Electric Power Sector comprises electricity-only and combined heat and power (CHP) plants within the North American Industrial Classification System 22 category whose primary business is to sell electricity, or electricity and heat, to the public (i.e., electric utility plants and Independent Power Producers (IPPs), including IPP plants that operate as CHPs). The All Sectors totals include the Electric Power Sector and the Commercial and Industrial Sectors (Commercial and Industrial power producers are primarily CHP plants).
Degree Days
Degree-days are relative measurements of outdoor air temperature used as an index for heating and cooling energy requirements. Heating degree-days are the number of degrees that the daily average temperature falls below 65° F. Cooling degree-days are the number of degrees that the daily average temperature rises above 65° F. The daily average temperature is the mean of the maximum and minimum temperatures in a 24-hour period. For example, a weather station recording an average daily temperature of 40° F would report 25 heating degree-days for that day (and 0 cooling degree-days). If a weather station recorded an average daily temperature of 78° F, cooling degree-days for that station would be 13 (and 0 heating degree days).
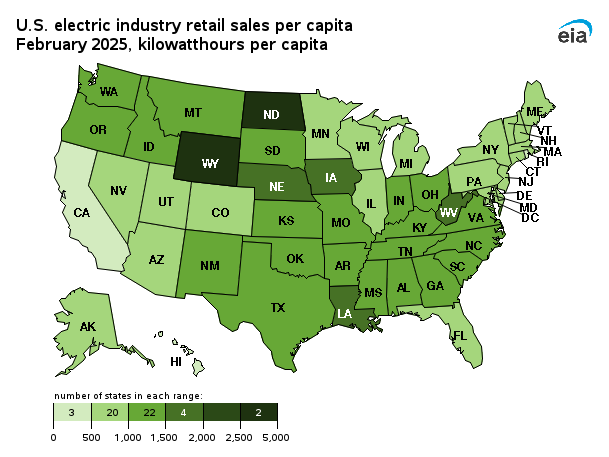
Per Capita Retail Sales
The per capita retail sales statistics use 2011 population estimates from the U.S. Census Bureau and monthly data collected by the Energy Information Administration. The volume of electricity delivered to end users for all sectors in kilowatthours is divided by the 2011 population estimate for each state.
Composition of Fuel Categories
Net generation statistics are grouped according to regions (see Electricity Monthly Update Explained Section) by generator type and fuel type. Generator type categories include:
- Fossil Steam: Steam turbines powered by the combustion of fossil fuels
- Combined Cycle: Combined cycle generation powered by natural gas, petroluem, landfill gas, or other miscellaneous energy sources
- Other Fossil: Simple cycle gas turbines, internal combustion turbines, and other fossil-powered technology
- Nuclear Steam: Steam turbines at operating nuclear power plants
- Hydroelectric: Conventional hydroelectric turbines
- Wind: Wind turbines
- Other renewables: All other generation from renewable sources such as geothermal, solar, or biomass
- Other: Any other generation technology, including hydroelectric pumped storage
Generation statistics are also displayed by fuel type. These include:
- Coal: all generation associated with the consumption of coal
- Natural Gas: all generation associated with the consumption of natural gas
- Nuclear: all generation associated with nuclear power plants
- Hydroelectric: all generation associated with conventional hydroelectric turbines
- Other Renewable: all generation associated with wind, solar, biomass, and geothermal energy sources
- Other Fossil: all generation associated with petroleum products and fossil-dervied fuels
- Other: all other energy sources including waste heat, hydroelectric pumped storage, other reported sources
Relative Fossil Fuel Prices
Relative fossil fuel prices are daily averages of fossil fuel prices by month, displayed in dollars per million British thermal units as well as adjusted for operating efficiency at electric power plants to convert to dollars per megawatthour. Average national heat rates for typical operating units for 2010 were used to convert relative fossil fuel prices.
Average Days of Burn
Average Days of Burn is defined as the average number of days remaining until coal stocks reach zero if no further deliveries of coal are made. These data have been calculated using only the population of coal plants present in the monthly Form EIA-923. This includes 1) coal plants that have generators with a primary fuel of bituminous coal (including anthracite) or subbituminous, and 2) are in the Electric Power Sector (as defined in the above "Sector definitions"). Excluded are plants with a primary fuel of lignite or waste coal, mine mouth plants, and out-of-service plants. Coal storage terminals and the related plants that they serve are aggregated into one entity for the calculation of Average Days of Burn, as are plants that share stockpiles.
Average Days of Burn is computed as follows: End of month stocks for the current (data) month, divided by the average burn per day. Average Burn per Day is the average of the three previous years' consumption as reported on the Form EIA-923.
These data are displayed by coal rank and by zone. Each zone has been formed by combining the following Census Divisions:
- Northeast — New England, Middle Atlantic
- South — South Atlantic, East South Central
- Midwest — West North Central, East North Central
- West — Mountain, West South Central, Pacific Contiguous
Coal Stocks vs. Days of Burn Stocks
The coal stocks data presented at the top of the Fossil Fuel Stocks section (“Coal Stocks”) will differ from the coal stocks presented in the Days of Burn section (“DOB Stocks”) at the bottom of the Fossil Fuel Stocks section. This occurs because Coal Stocks include the entire population of coal plants that report on both the annual and monthly Form EIA-923. The DOB Stocks only include coal plants that report on the monthly Form EIA-923 and have a primary fuel of bituminous (including anthracite) or subbituminous as reported on the Form EIA-860.