
How does EIA account for small differences between energy supply and demand data?
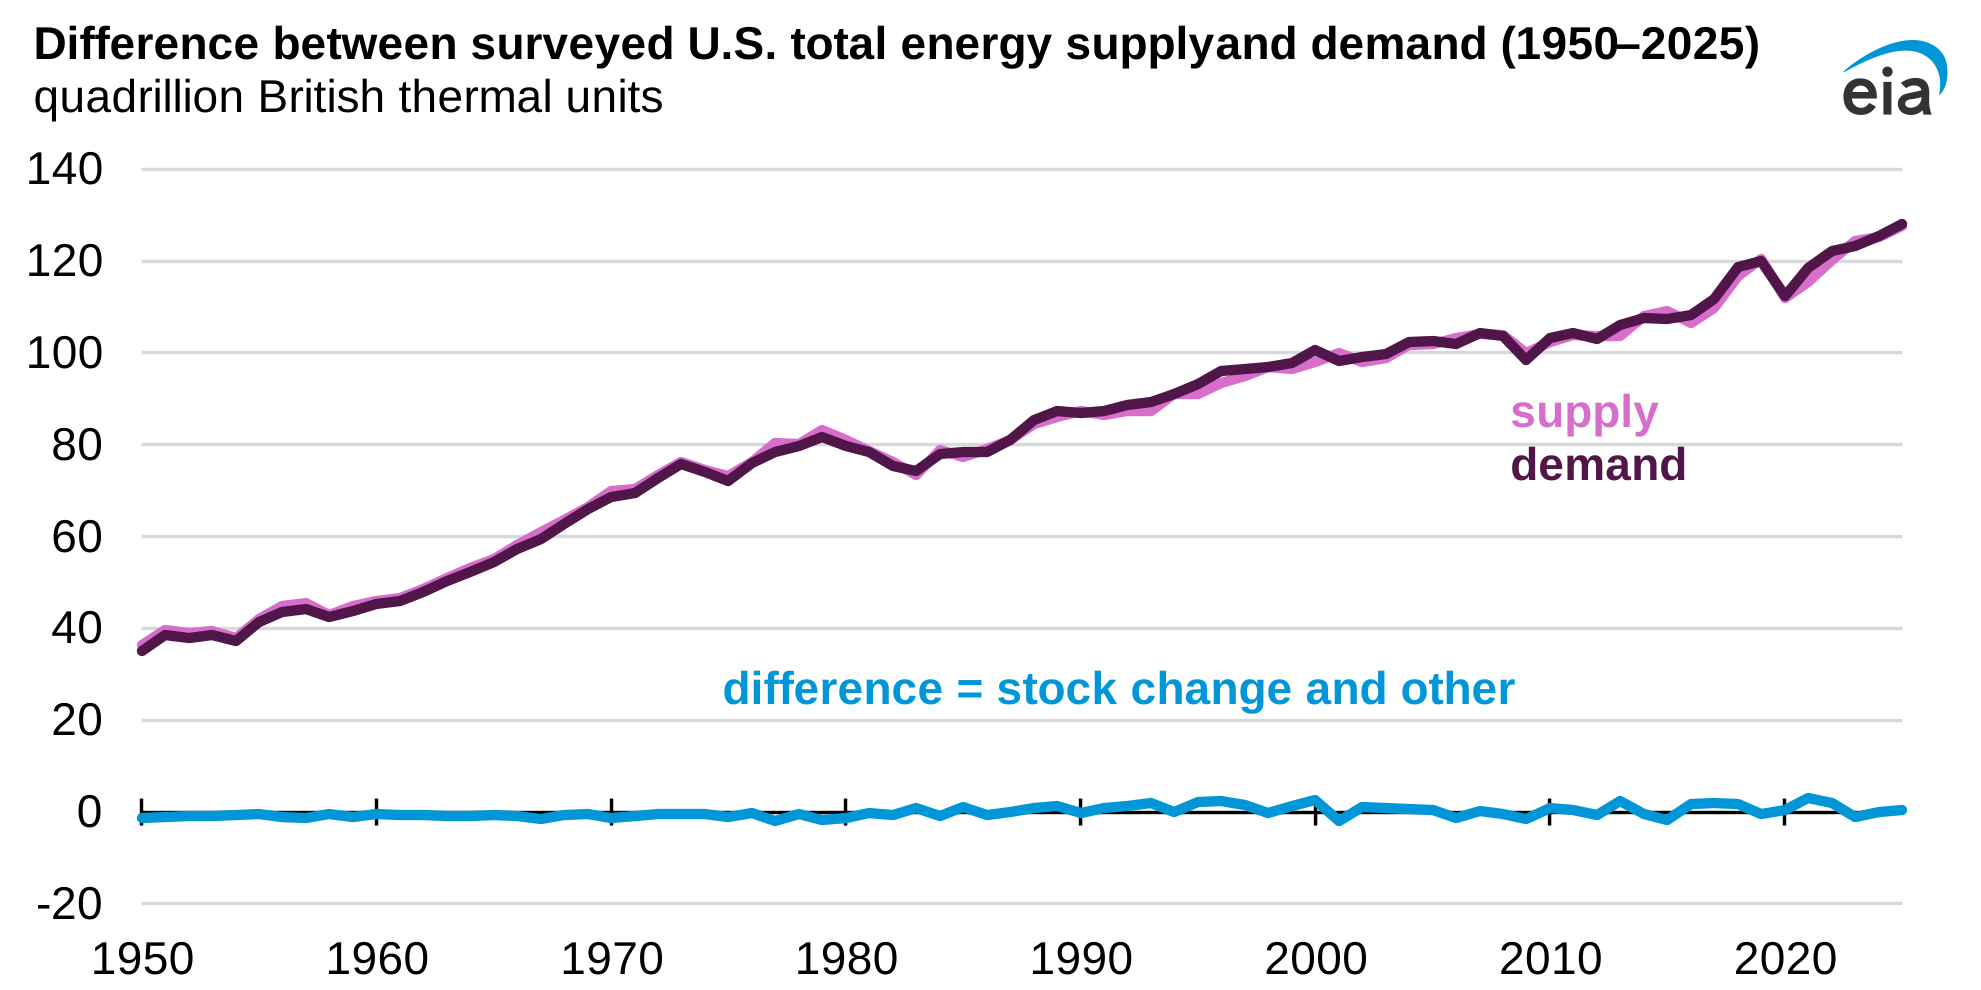
Note: Supply = production + imports; demand = consumption + exports; demand - supply = stock change + other
EIA uses over 60 surveys to collect data on the U.S. energy sector’s supply and demand. In theory, supply and demand should balance. In practice, we often have small differences between our total supply and total demand figures.
To account for the differences between U.S. total primary energy supply and demand, our Monthly Energy Review includes a stock change and other data series, a grouping of items that account for the differences between supply and demand each month.
These accounting differences represent a very small share of energy markets. In 2025, our combined surveys accounted for about 128 quadrillion British thermal units (quads) each for U.S. energy supply and demand, and stock change and other was 0.4 quads—about 0.3% of the total.
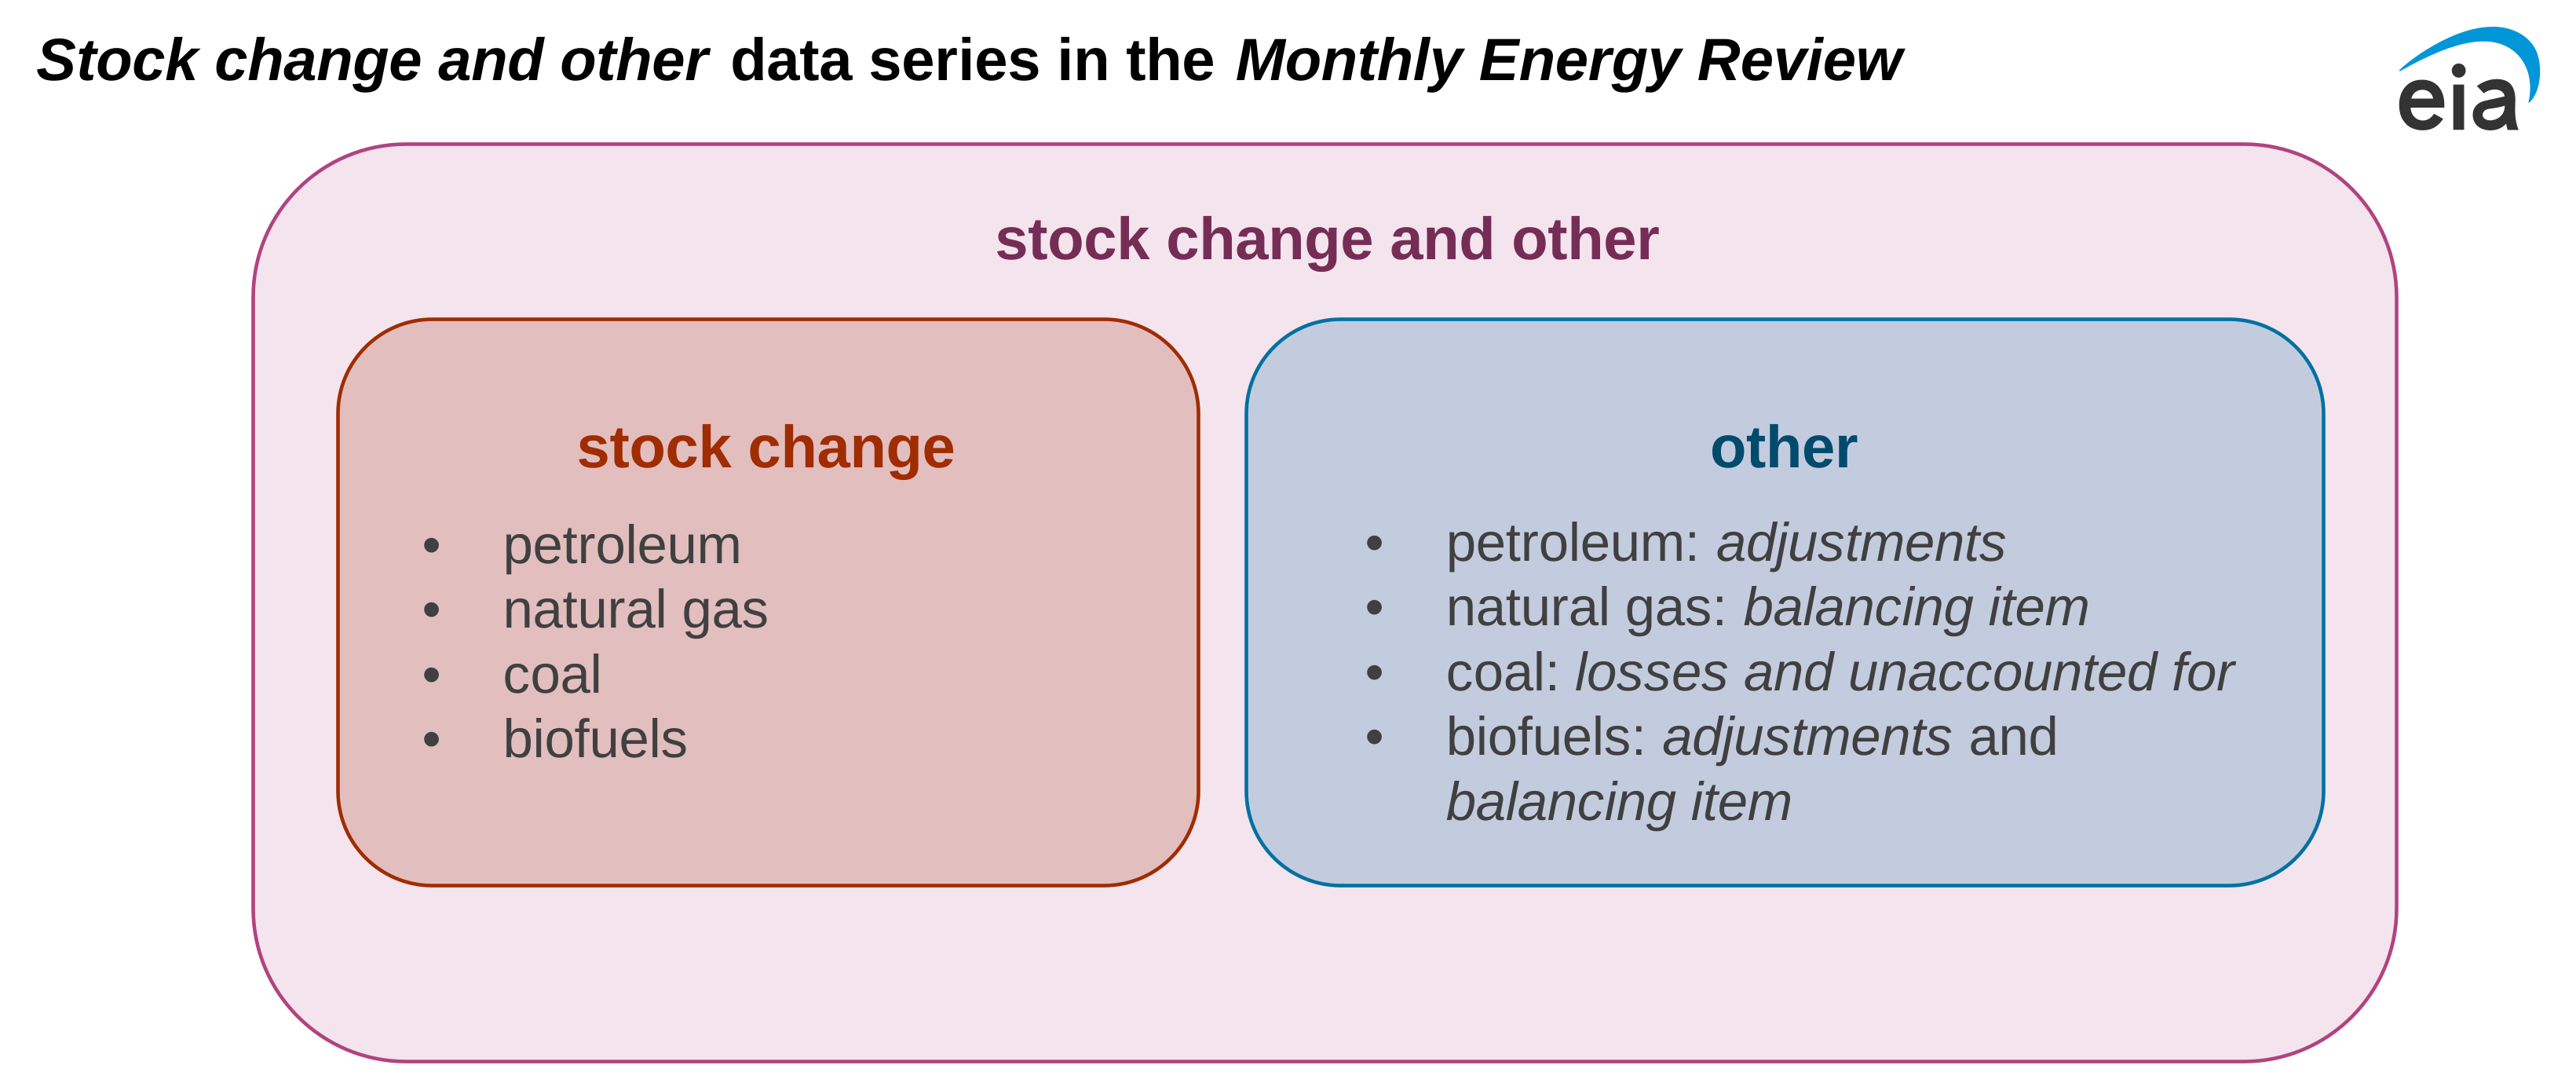
Stock change is the net difference between energy held in storage at the beginning and end of a month.
The other portion of stock change and other represents the many forms of small accounting differences:
- Differences in survey respondent accounting and reporting practices
- Differences in timing between energy activity occurrences and reporting periods
- Measurement and estimation errors
- Limitations in data collection systems and survey coverage
- Energy lost during transfers or storage
- Unreported energy activities
To document the other differences between supply and demand, besides stock change, we use various adjustments, balancing items, and losses and unaccounted for series, a standard statistical accounting practice. Rather than indicating a flaw in the underlying statistics, these series ensure that published data are consistent and transparent, while also providing a measure of the uncertainty associated with our survey data.
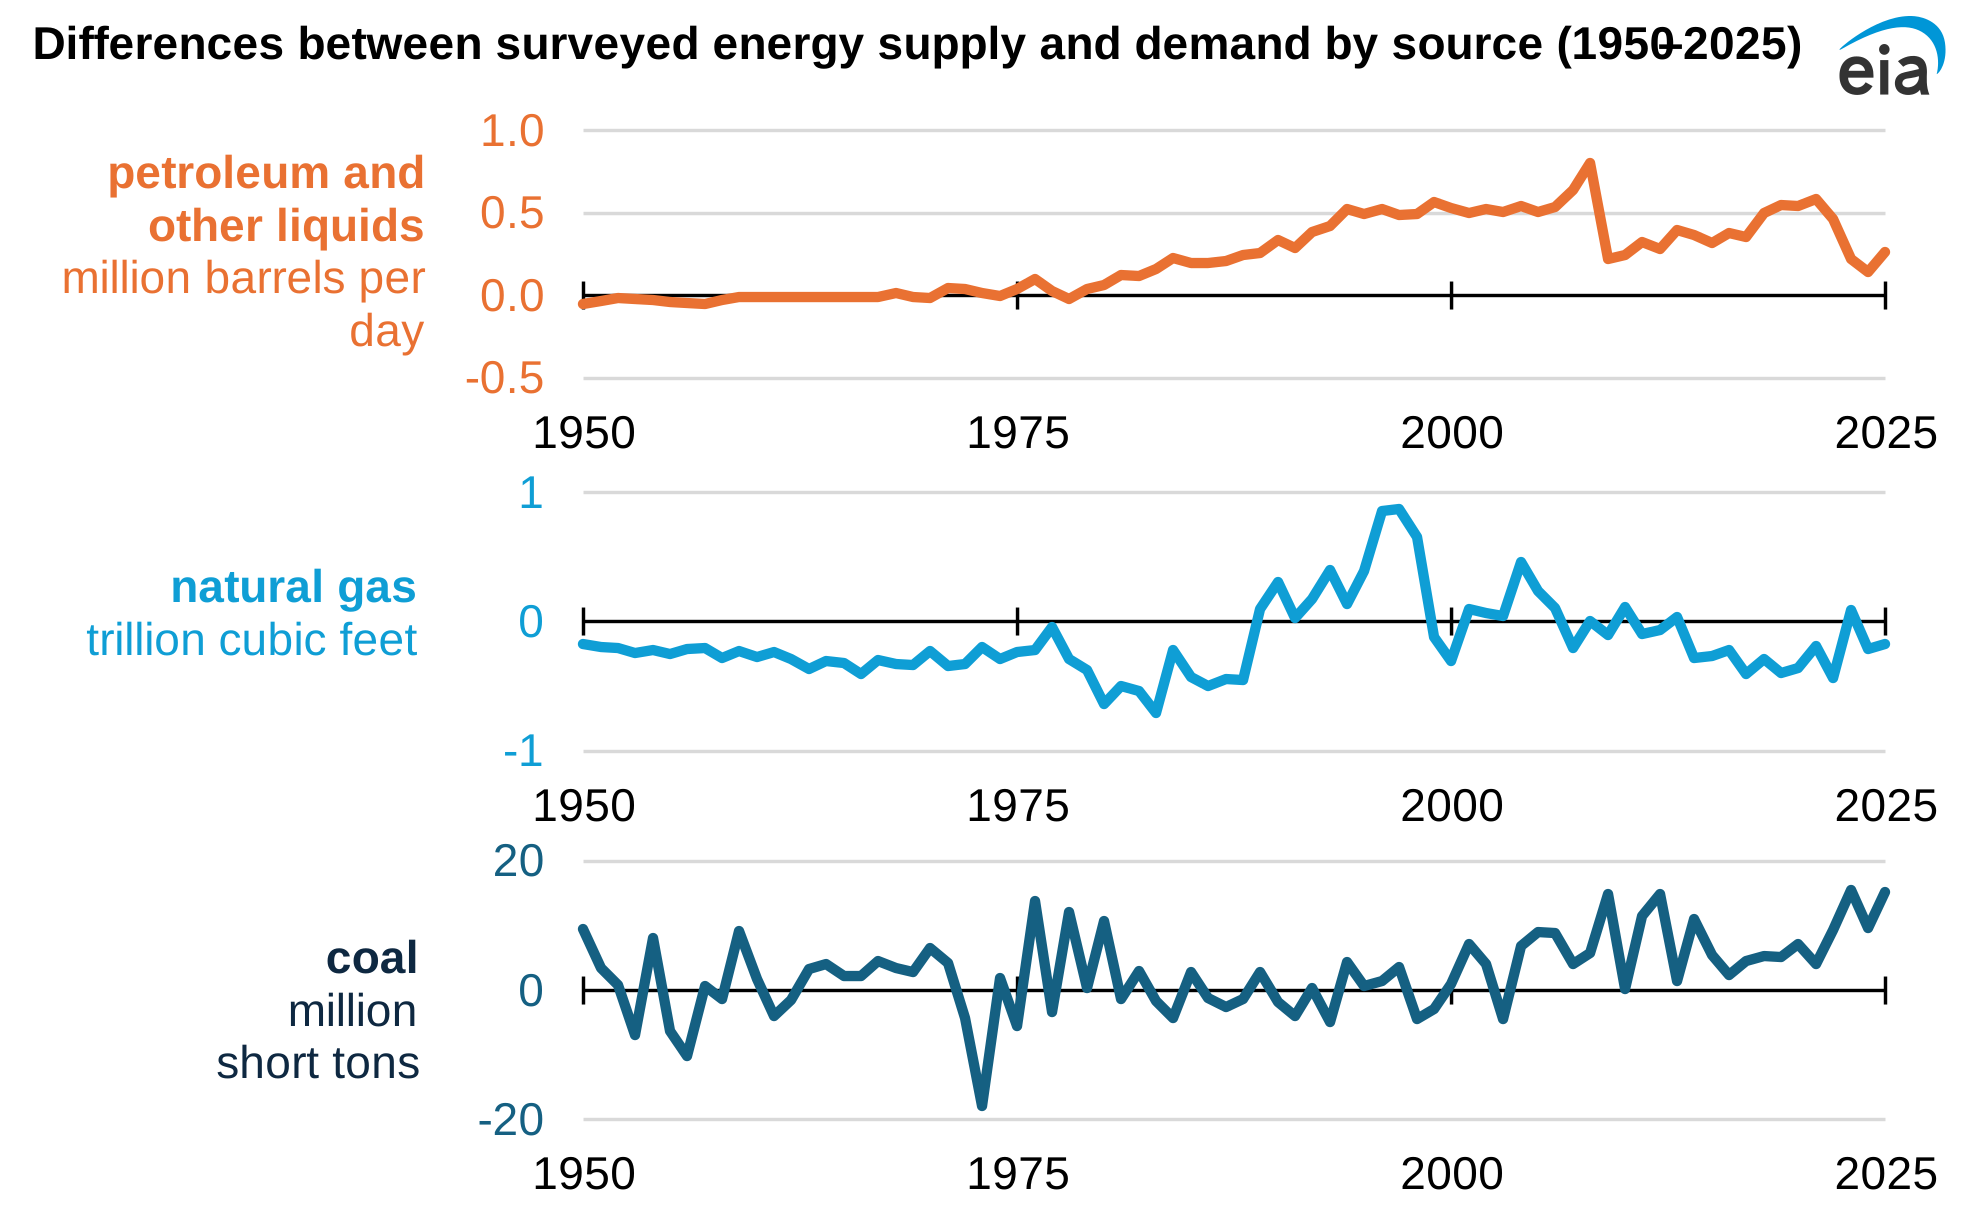
For petroleum and biofuels, our adjustments series accounts for the fact that survey responses may not precisely reflect actual activity. We’ve made improvements to our petroleum data over time to account for changes in transfers to crude oil supply, motor gasoline blending components, distillate fuel oil by pipeline operations, and other developments in petroleum markets. See Appendix B of our Petroleum Supply Monthly for more details.
For natural gas, our balancing item series accounts for differences between supply and demand. Some of the differences are because of natural gas lost to the atmosphere. Also, there can be differences in conversions of flow data metered at varying temperatures and pressures, variations in company accounting and billing practices, and differences between billing cycles and calendar periods. See Appendix A of our Natural Gas Monthly for more details.
For coal, we use a losses and unaccounted for series to represent differences in supply and demand, including coal lost during transport and various accounting and timing issues. In 2009, because of incomplete data coverage and different source data, biofuels have a small balancing item to balance biodiesel supply and demand.
Principal contributors: Allen McFarland, Mickey Francis