
Henry Hub natural gas prices this summer were 6% lower than last summer
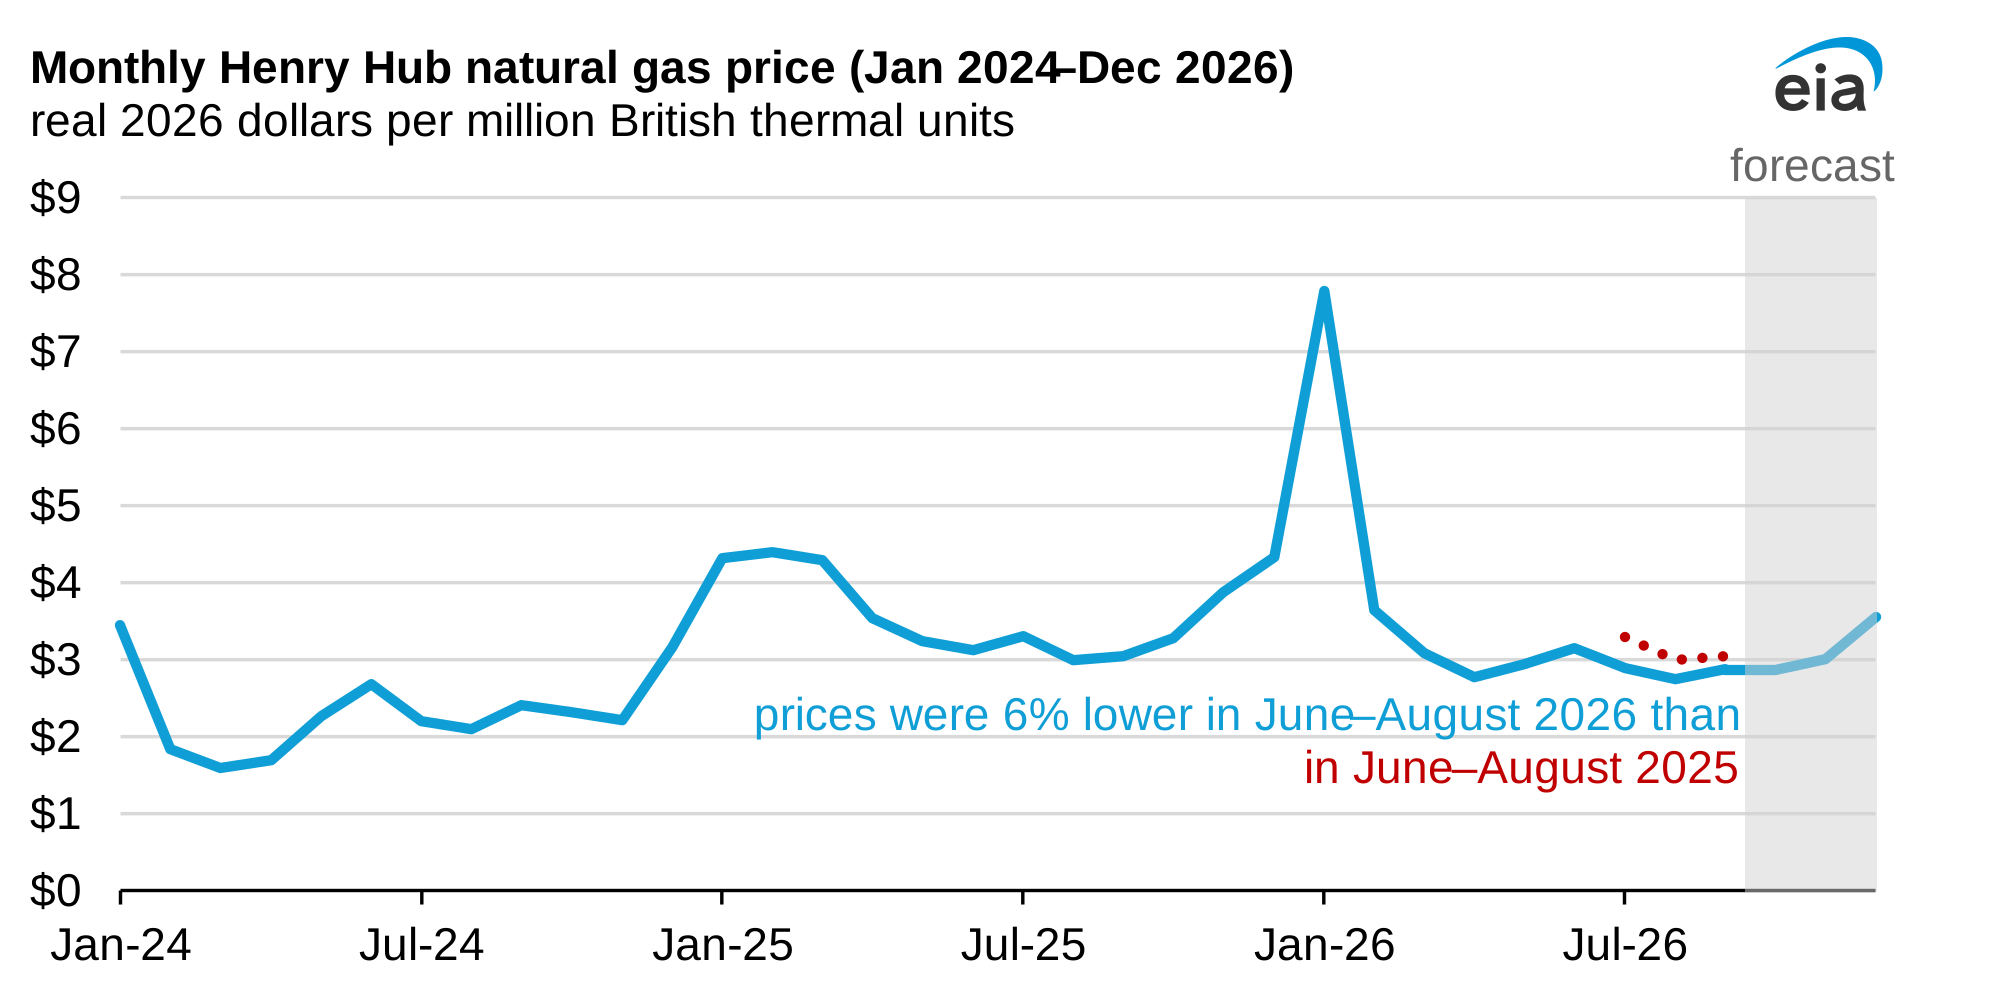
The Henry Hub natural gas spot price averaged $2.93 per million British thermal units from June through August, 6% less than the same period last year. Prices were lower this summer despite exceptionally hot weather that increased electricity demand for air conditioning. Natural gas-fired power plants often help meet higher demand during such periods.
The average temperature in the Lower 48 states was 77°F in July, the warmest ever for the month, according to data from the National Oceanic and Atmospheric Administration. Increased renewable electricity generation, record natural gas production, and ample natural gas inventories helped limit upward pressure on prices. Further, maintenance at liquefied natural gas terminals moderated demand growth from that sector.
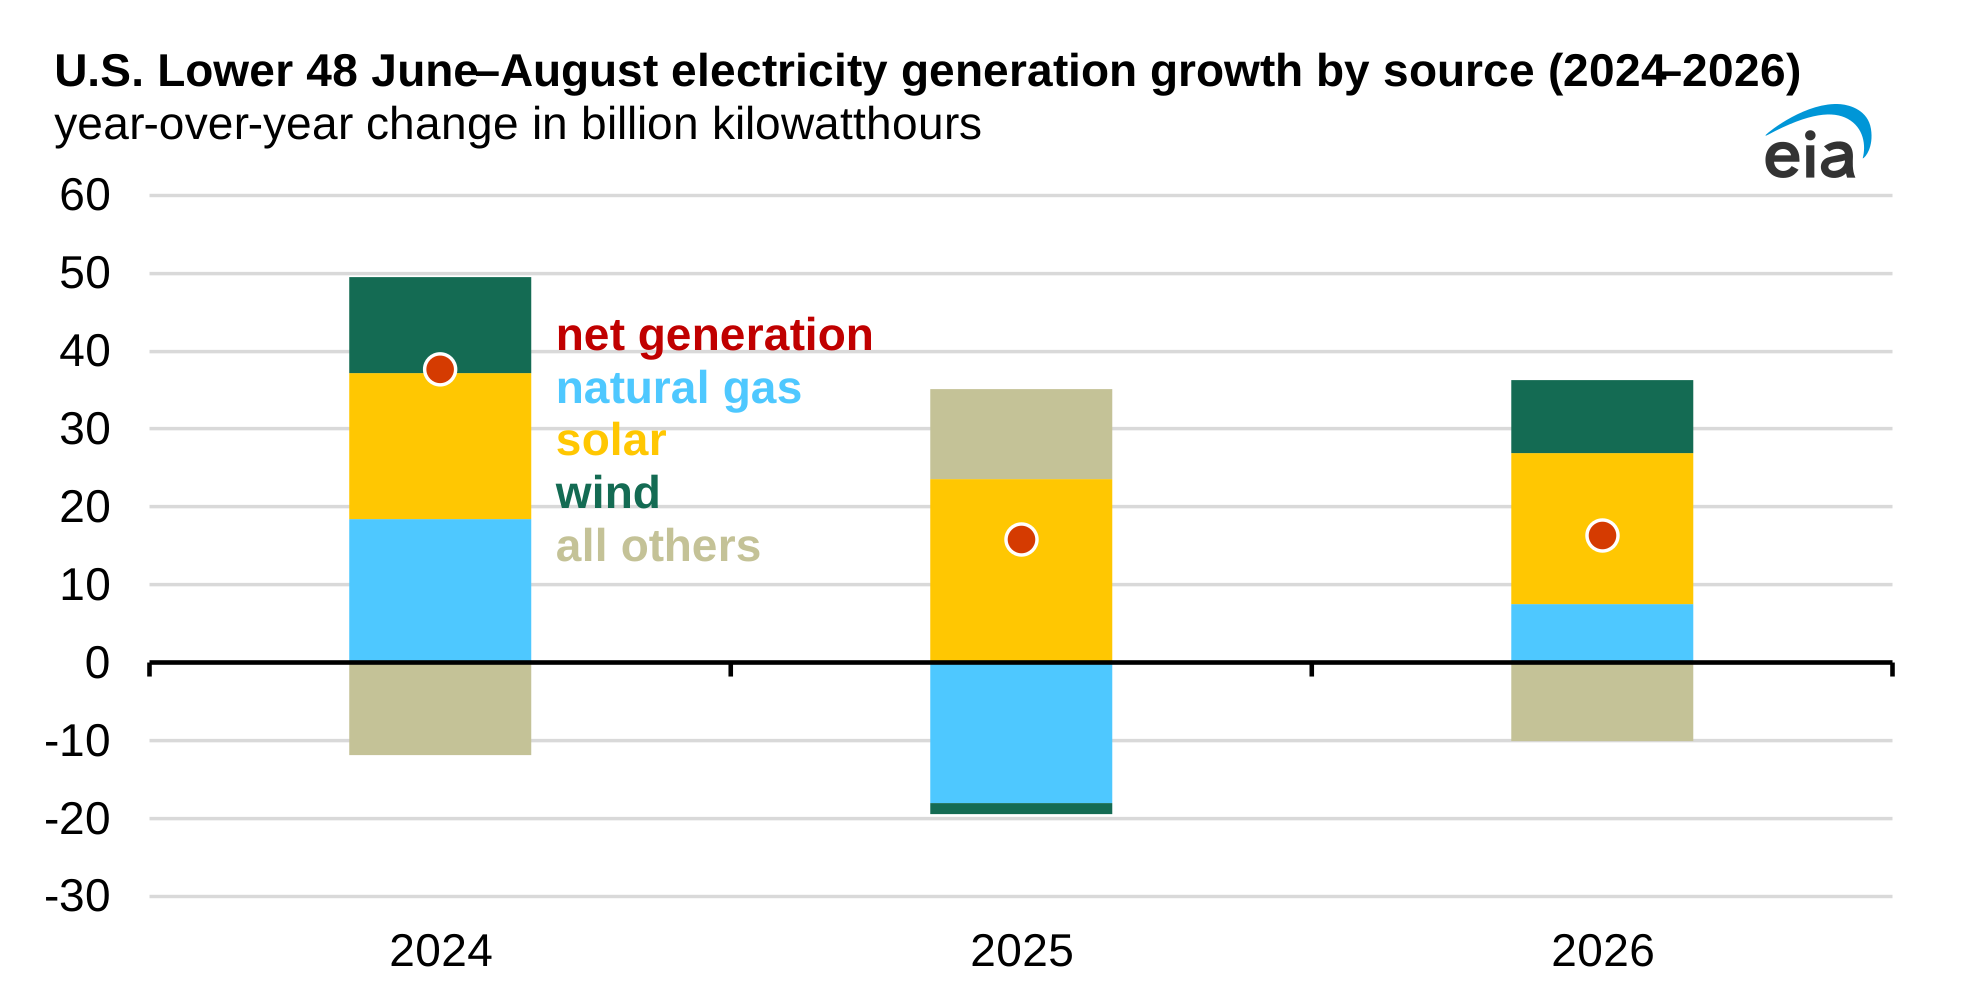
We estimate that additions in renewable capacity and generation reduced the amount of natural gas needed to meet higher summer electricity demand this year. Solar generation increased by an estimated 19.4 billion kilowatthours (BkWh) compared with the same period in 2025, and wind generation increased by 9.3 BkWh our latest Short-Term Energy Outlook (STEO) indicates. Natural gas-fired generation increased by 7.5 BkWh.
Natural gas supply has also remained strong, limiting support for higher Henry Hub prices this year. U.S. natural gas production has set numerous monthly record highs in 2026 so far, increasing the amount of natural gas available to meet domestic consumption and exports, while replenishing underground storage. In our September STEO, we expect dry natural gas production will set a record 111.2 billion cubic feet per day (Bcf/d) in 2026. We estimate natural gas production was 2% (2.7 Bcf/d) more from June through August 2026 than during the same period last year. Higher production is supported by growth in several producing regions, most notably in the Permian.
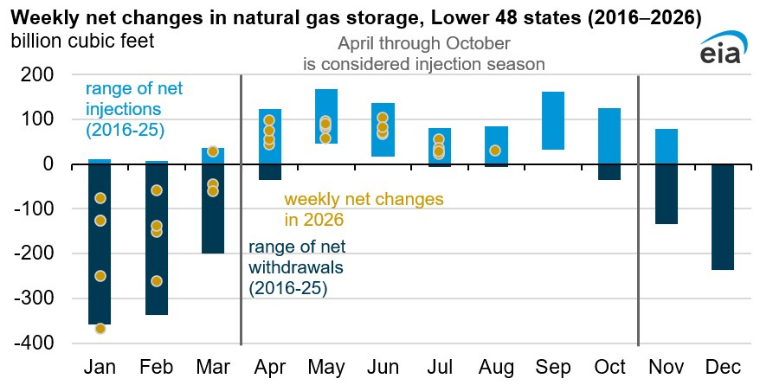
Working natural gas inventories entered the 2026 injection season, which begins in April, at 1,906 billion cubic feet (Bcf), 4% more than the previous five-year average. Storage injections have remained relatively strong since then. Monthly injections were above their respective five-year averages in each month of the injection season through August aside from May, helping maintain ample inventories despite the increased summer demand. This combination of strong production and sustained injections has kept storage volumes at levels that provide a substantial supply cushion heading toward the winter heating season. In our August STEO, we forecast Lower 48 states working natural gas inventories will total 3,985 Bcf at the end of October, 5% more than the five-year average.
Principal contributor: Andrew Iraola
Tags: natural gas, Henry Hub