
United States on track for record crude oil production in 2026
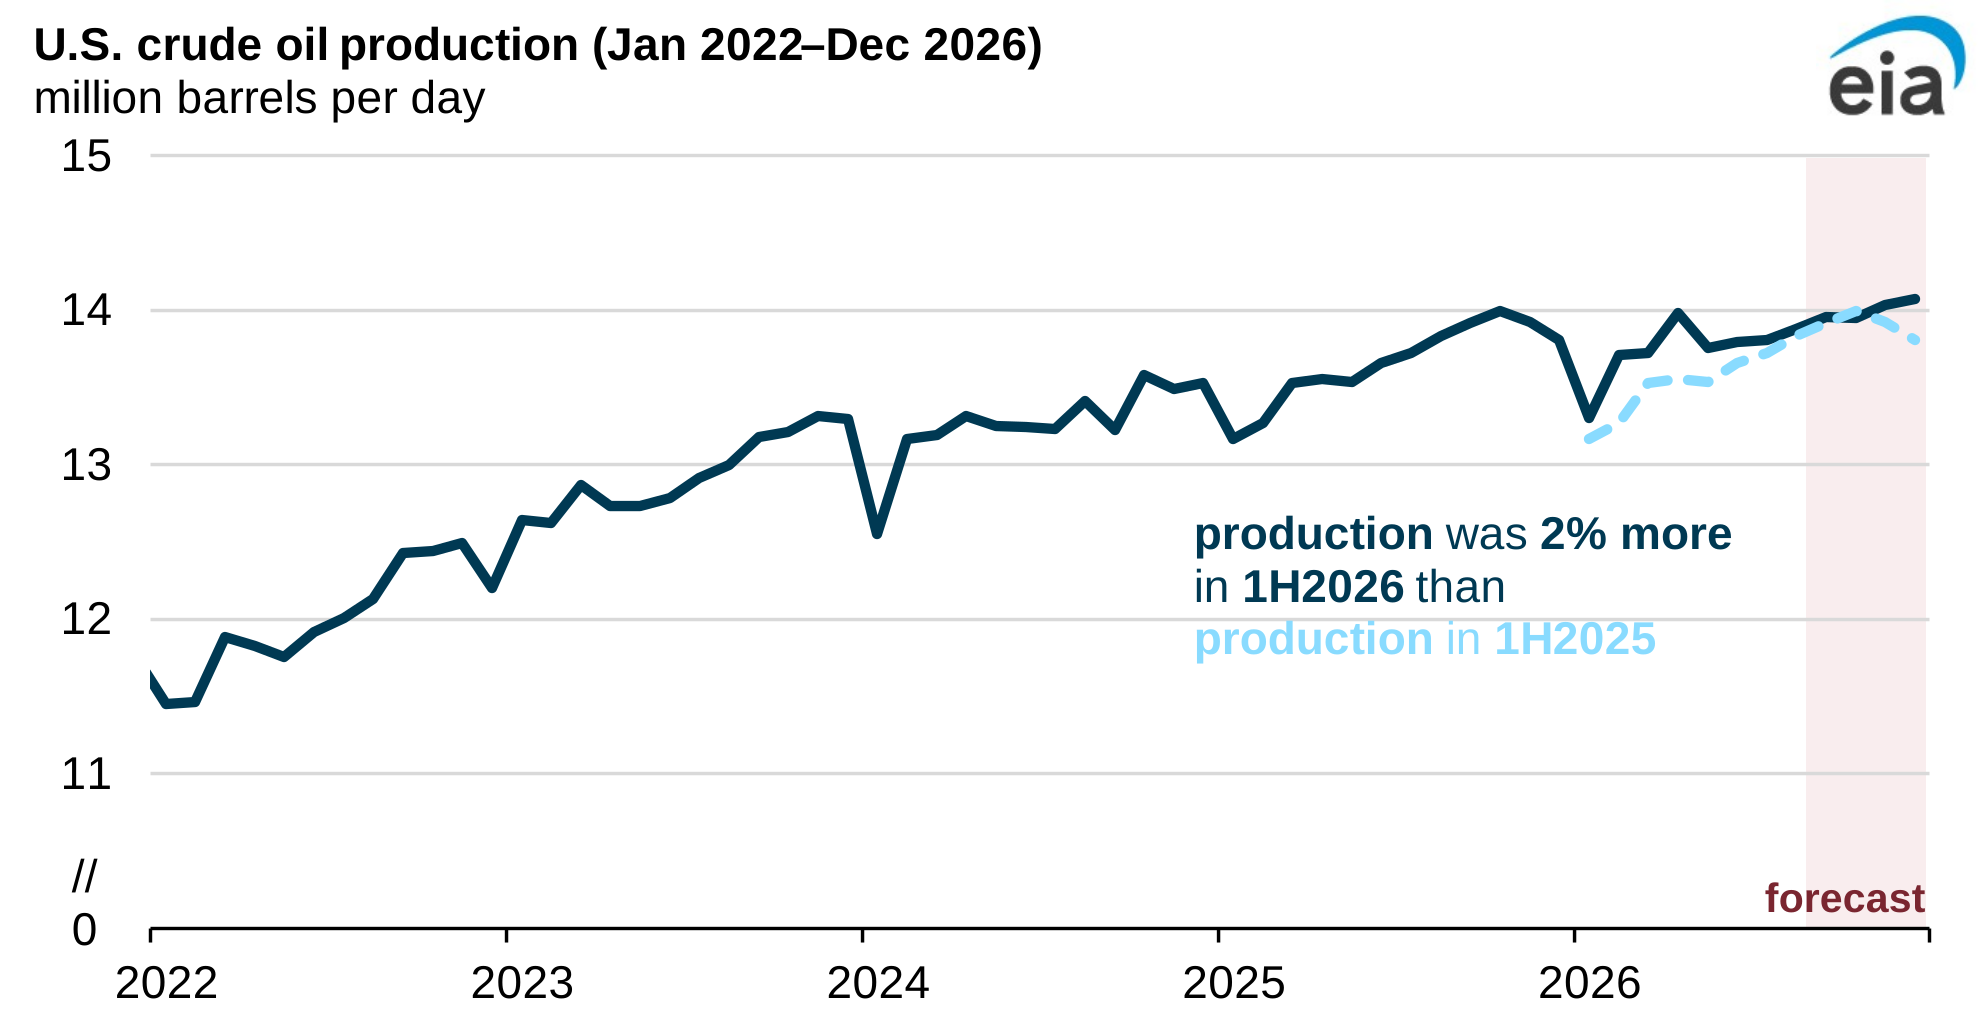
Note: 1H2026=first half of 2026
We forecast U.S. crude oil production will average 13.8 million barrels per day (b/d) in 2026, surpassing the previous record of 13.7 million b/d set in 2025, in our latest Short-Term Energy Outlook (STEO).
In the first half of 2026 (1H26), crude oil production averaged 13.7 million b/d, 2% (0.3 million b/d) more than the same period in 2025. Most of this expansion is concentrated in the Permian region in Texas and New Mexico and the Federal Gulf of America.
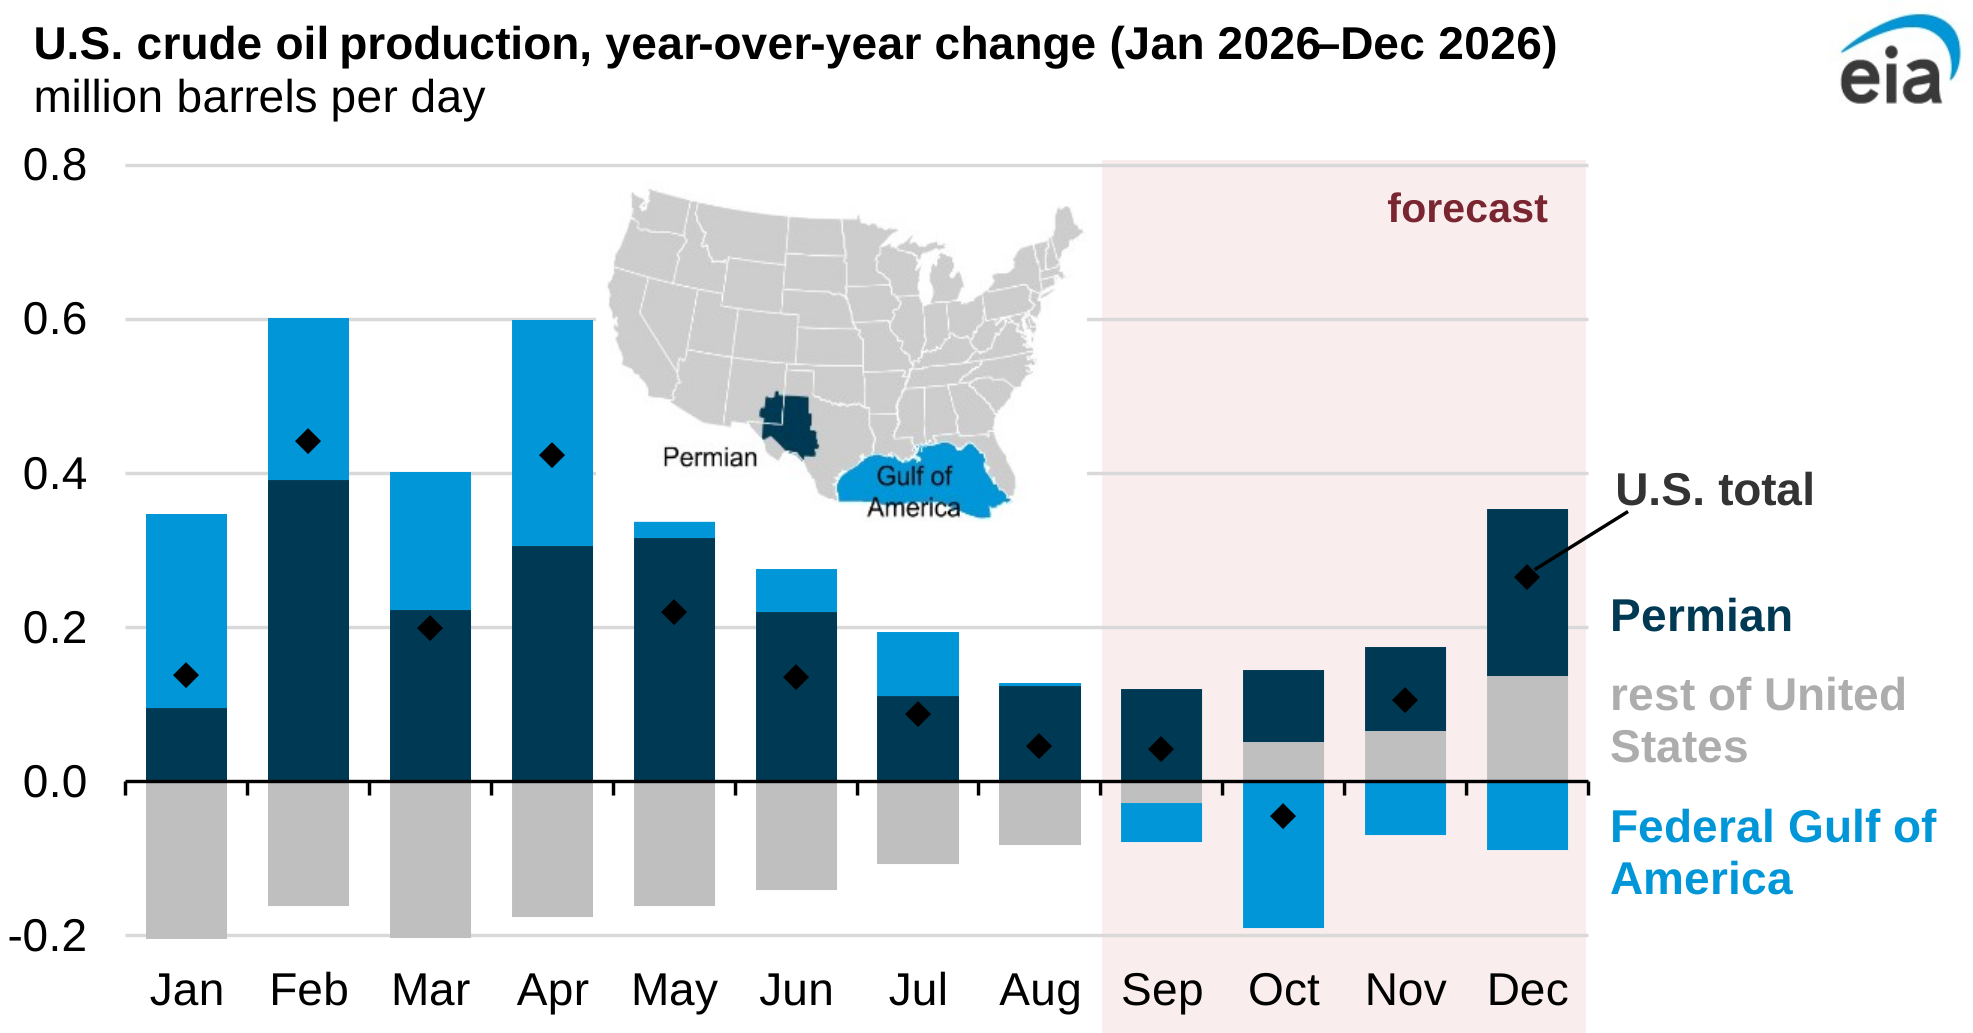
Permian. We forecast Permian oil production will average 6.8 million b/d in 2026, 3% more than in 2025. Production growth in the Permian region is driven by higher crude oil prices.
West Texas Intermediate (WTI) crude oil prices rose from an average of $65 per barrel (b) in 2025 to an average of $84/b through August 2026, more than the region’s average breakeven price—the minimum price needed for an operation to cover its costs. Oil industry executives responding in March to the Dallas Fed Energy survey reported average breakeven prices of $69/b in the Permian’s Midland Basin and $63/b in the Delaware Basin, the two largest basins in the Permian. Higher prices support oil-directed drilling in the Permian region and the resulting rise in crude oil production.
Federal Gulf of America. Crude oil production increased by 0.2 million b/d (10%) in 1H26 compared with 1H25. We forecast oil production will increase 3% (0.1 million b/d) in 2026.
The increased production in the Federal Gulf of America during 1H26 is primarily the result of four new major projects that have come online in the last year:
- The Shenandoah Floating Production Unit (FPU) drawing from the Shenandoah field, which has produced an average of 70,000 b/d since it came online in July 2025
- The Ballymore subsea tieback to the Blind Faith facility drawing from the Ballymore field, which has produced an average of 58,000 b/d since it came online in April 2025
- The Whale FPU drawing from the Whale field, which has produced an average of 38,000 b/d since it came online in January 2025
- The Salamanca FPU drawing from the Leon and Castile fields, which has produced an average of 25,000 b/d since it came online late 2025
We expect four new, smaller projects to come online by the end of 2026, further contributing to forecast production growth this year.
Hurricanes in the Gulf of America could disrupt the production and development timeline of these new projects, although experts predict a milder-than-normal hurricane season this year. The latest forecast from Colorado State University expects that the 2026 Atlantic Basin hurricane season, which lasts from June through November, will have below-normal activity due to El Niño conditions.
Principal contributor: Trinity Manning-Pickett