
New England natural gas prices have been trading near record discounts to Henry Hub
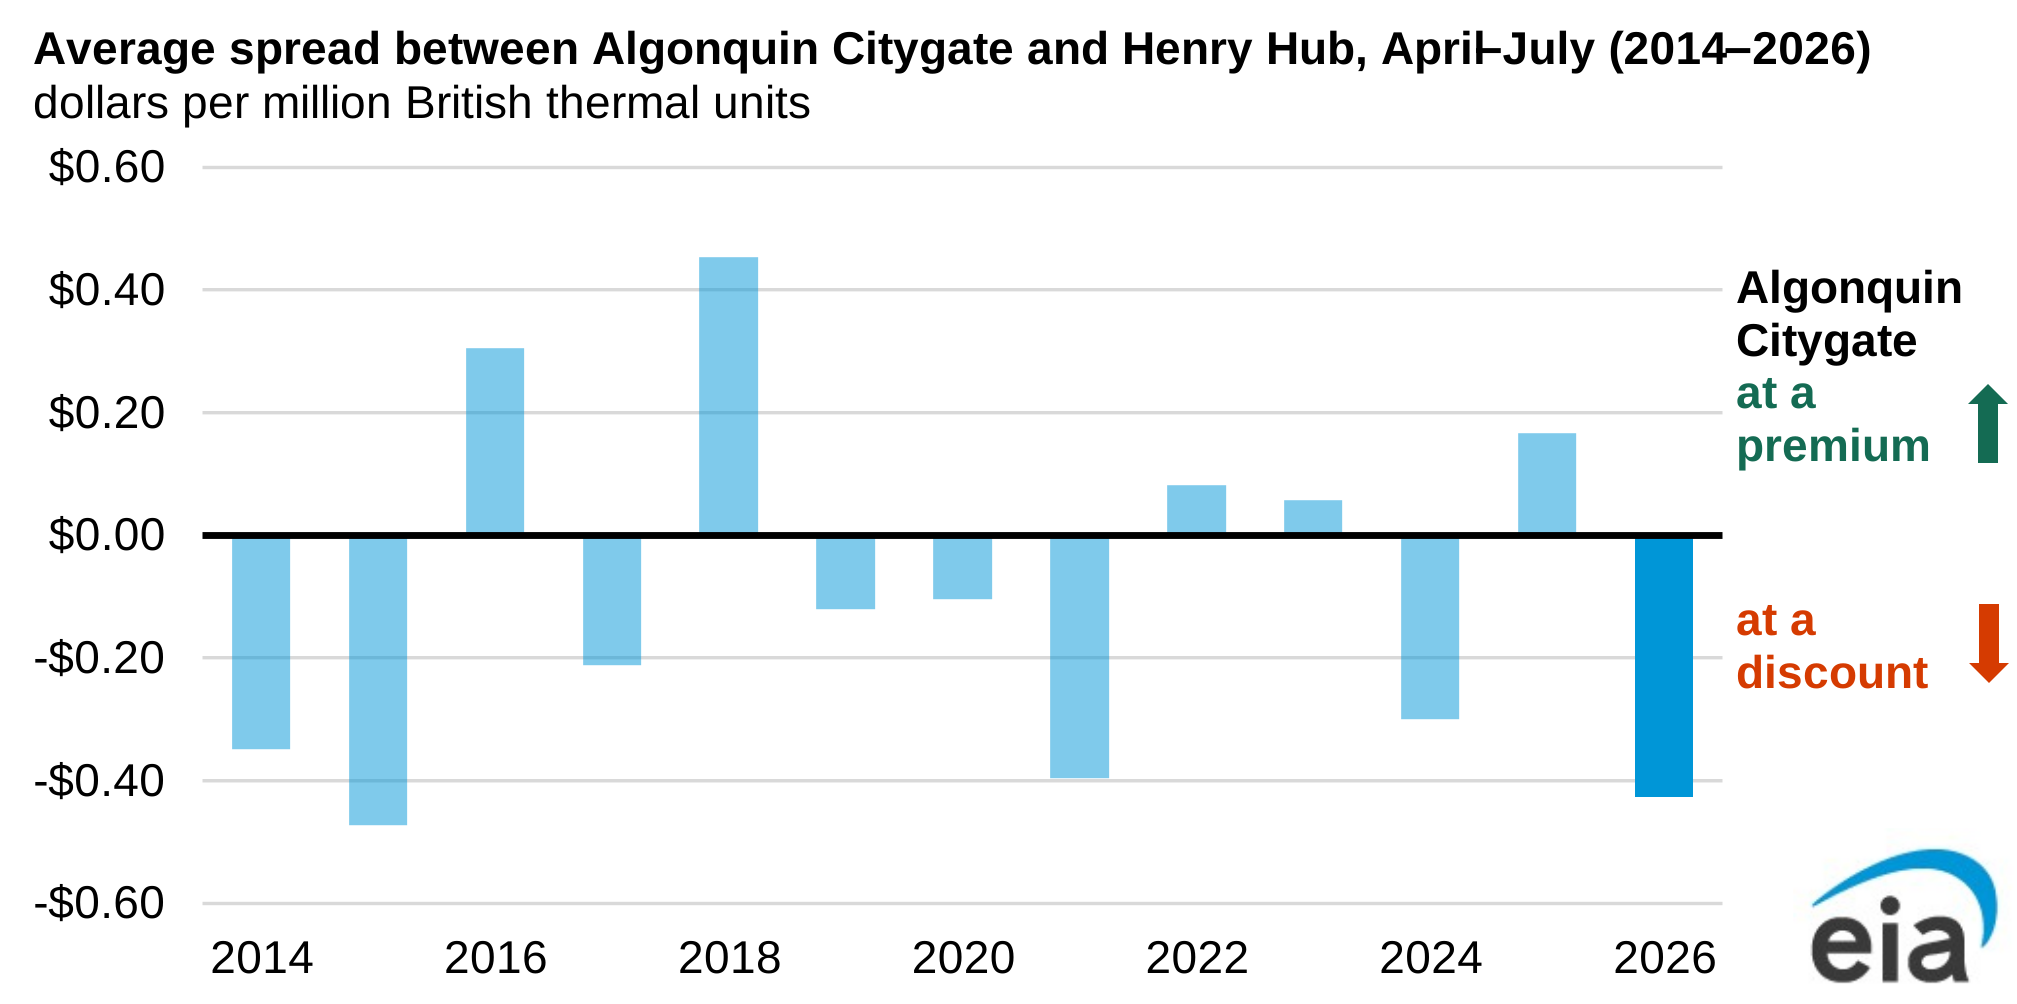
Low-cost Appalachian and Canadian natural gas supplies coupled with lower-than-usual regional consumption have pushed down natural gas prices at a major New England pricing hub in recent months to trade at a discount to the widely cited U.S. benchmark, Henry Hub.
Natural gas prices at Algonquin Citygate averaged 43 cents per million British thermal units (MMBtu) less than Henry Hub from April through July 2026, the second-largest discount for the period, according to Natural Gas Intelligence data going back to 1999.
Over the past several years, the price for natural gas at Algonquin Citygate typically traded at a premium to Henry Hub during the winter months as natural gas demand increased for home heating. In the spring and summer months, as home heating demand decreased and solar generation increased, demand for natural gas fell and Algonquin often traded at a discount to Henry Hub.
Algonquin prices have remained relatively low in springtime in part because of access to low-cost natural gas from the Appalachian region. In 2025, Appalachia accounted for 31% of U.S. marketed natural gas production, more than any other region. Between April and July 2026, the Appalachia Regional average hub price was 77 cents/MMBtu lower than Henry Hub, the second-widest discount ever reported. Pipeline connections from Appalachia into the Northeast provide New England with access to this relatively low-priced natural gas.
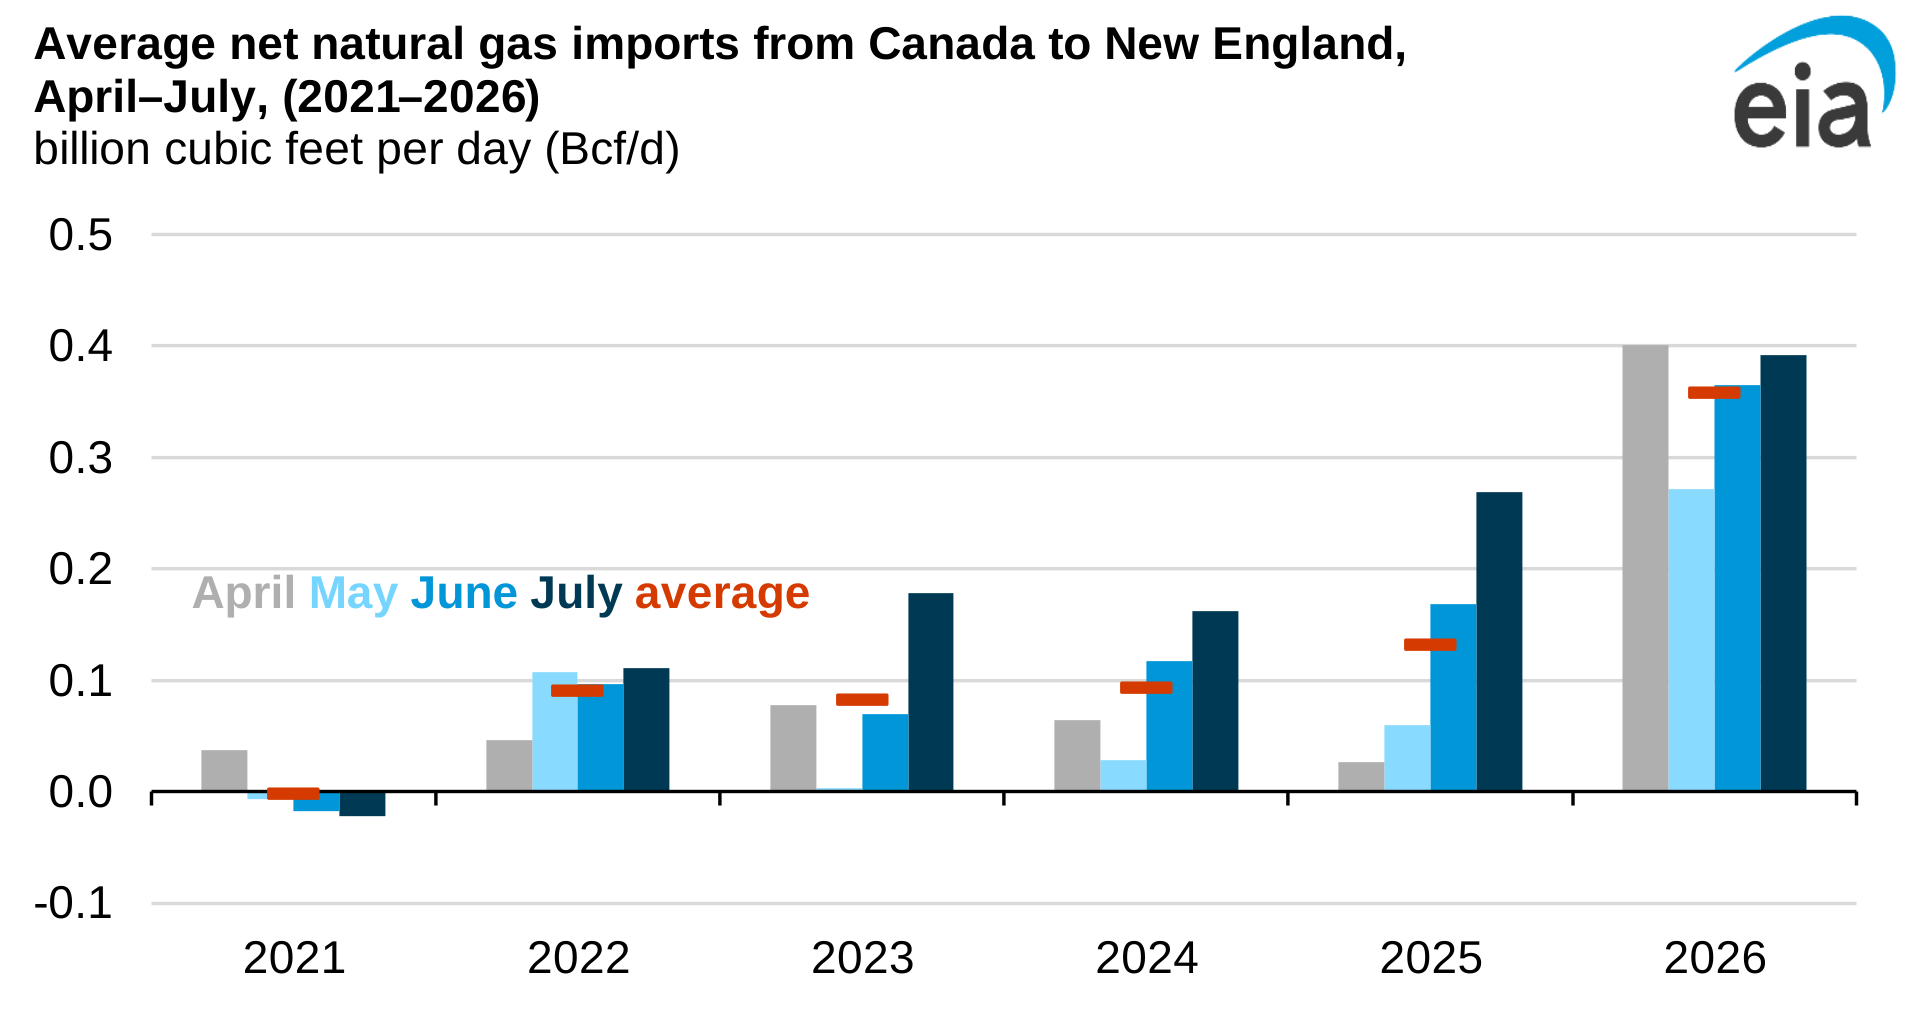
New England is also receiving a record-high volume of natural gas imports from Canada this year. According to data from S&P Global Energy, monthly net flows of natural gas from Canada into New England averaged a record 0.4 billion cubic feet per day (Bcf/d) from April through July, more than 2.5 times the volume during the same period in 2025.
The increase in regional supply also coincided with lower natural gas demand in New England. Total natural gas consumption from April through July 2026 was 5% lower than during the same period in 2025, according to S&P Global Energy data. Electricity generation is typically one of the largest consumers of natural gas. Between April and July, New England electricity generation from natural gas decreased by 1.1 billion kilowatthours (BkWh) (6%) compared with the same period in 2025, according to EIA’s Hourly Electricity Grid Monitor. During the same period, wind generation increased by 0.7 BkWh (59%) and utility-scale solar generation increased by 0.2 BkWh (29%).
Principal contributor: Andrew Iraola
Tags: New England, natural gas, prices, gasoline