
U.S. natural gas production reached a new record in 2025
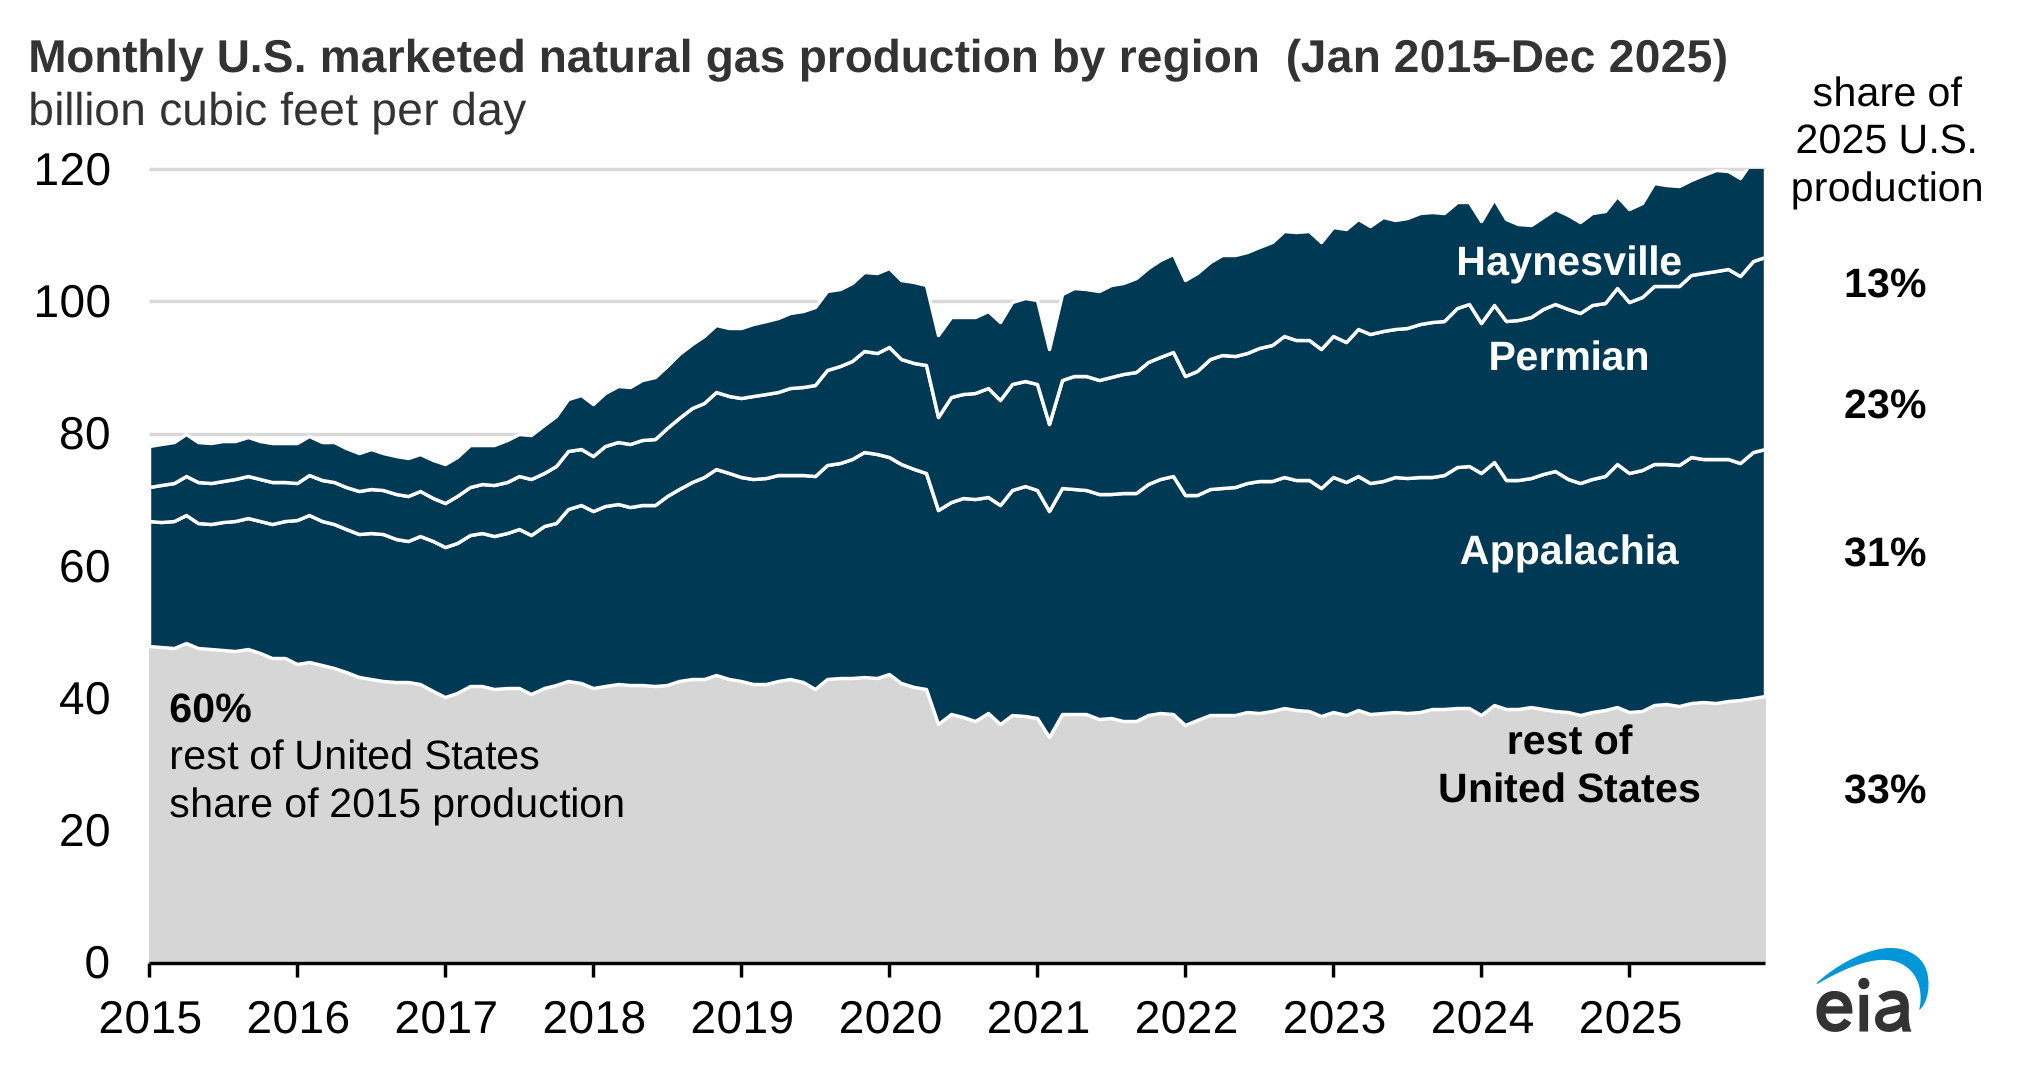
U.S. marketed natural gas production reached a new record in 2025, growing by 5.3 billion cubic feet per day (Bcf/d) to average 118.5 Bcf/d, according to our latest Natural Gas Monthly. Three regions—Appalachia, Permian, and Haynesville—accounted for 67% of the total marketed gas production in the United States in 2025 and for 81% of the growth last year.
Our Short-Term Energy Outlook breaks out U.S. Lower 48 (L48) marketed natural gas production data for the Appalachia, Bakken, Eagle Ford, Haynesville, and Permian regions and also includes Alaska and Gulf of America production data. In 2025, Henry Hub spot prices rose by 60% to $3.52 million British thermal units (MMBtu), which contributed to growth in all regions. The Appalachia, Permian, and Haynesville regions accounted for 4.2 Bcf/d growth while other regions accounted for the remaining 1.1 Bcf/d growth.
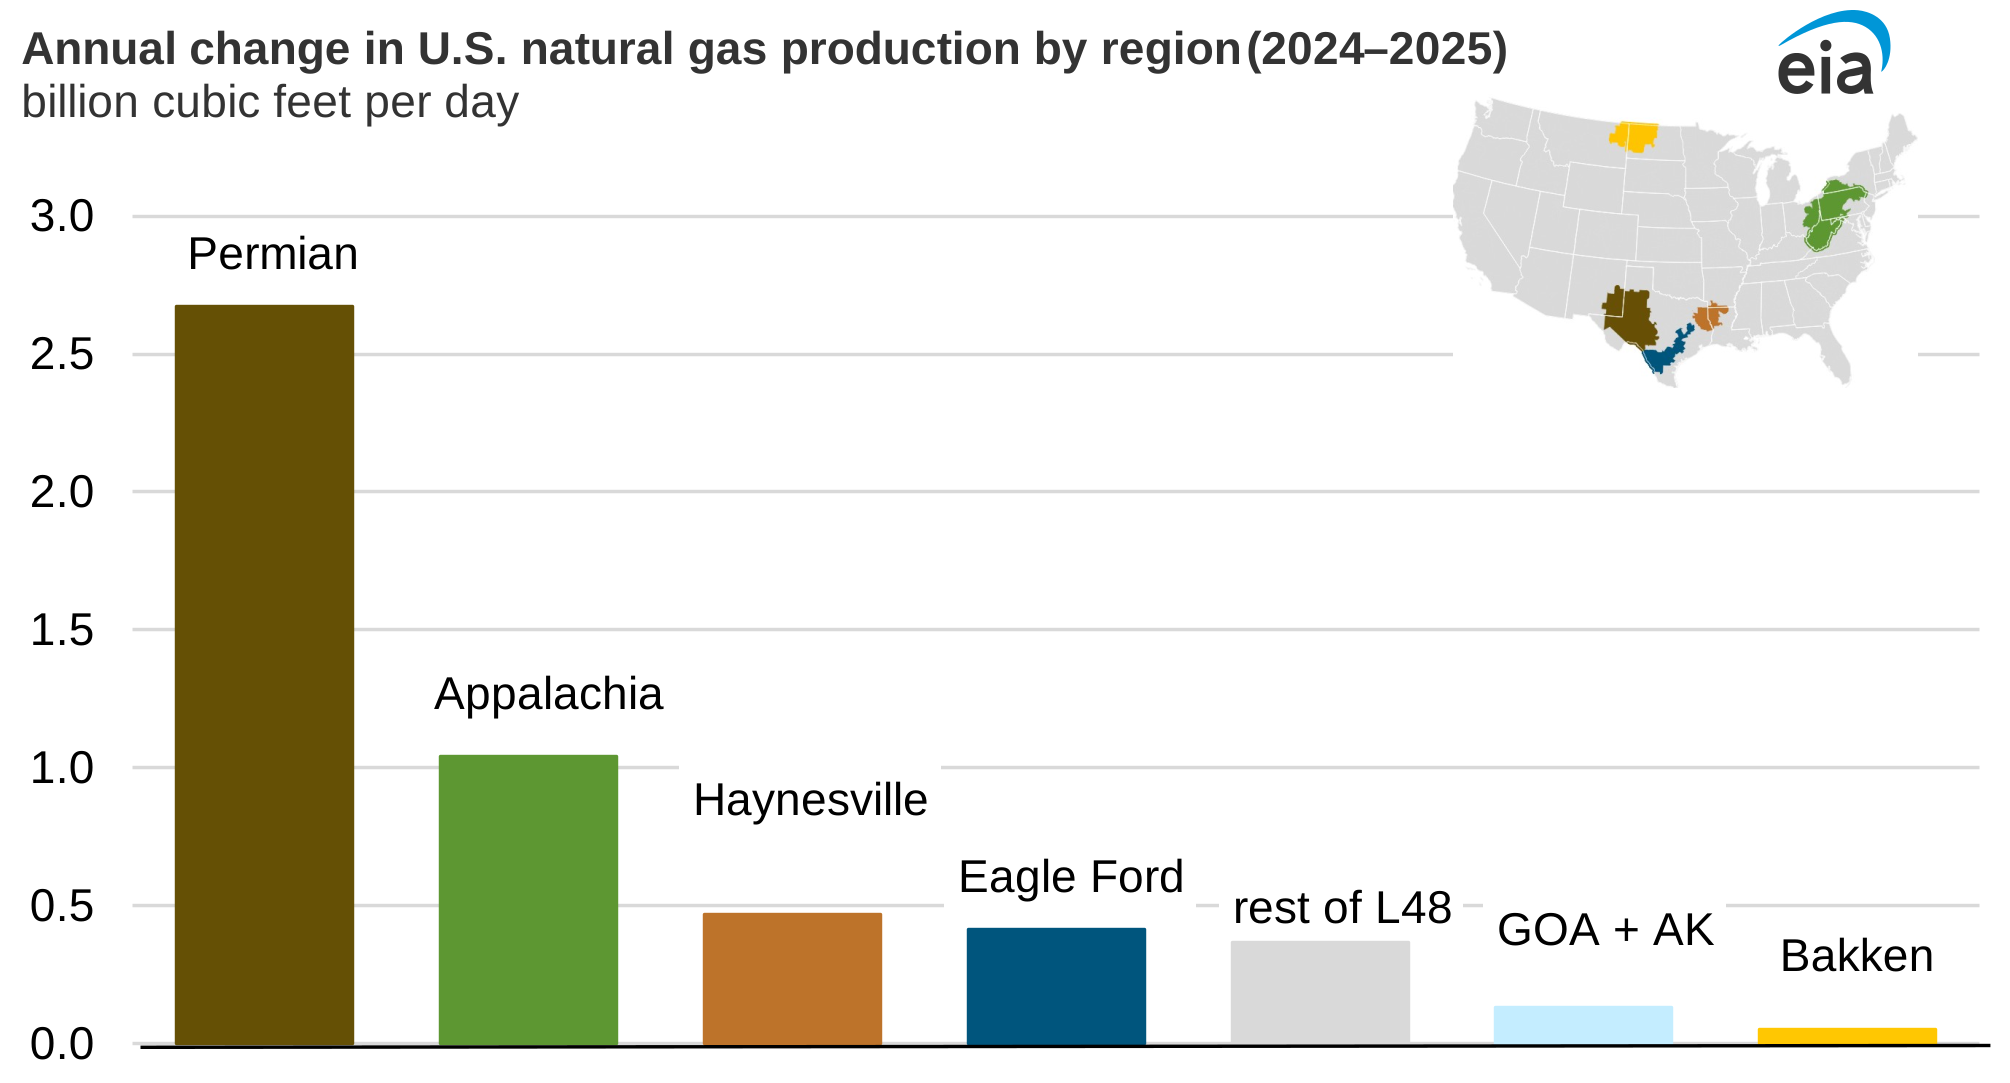
Note: GOA=Gulf of America, AK=Alaska, L48=Lower 48 U.S. states
In 2025, more natural gas was produced in the Appalachia region of the Northeast than in any other U.S. region, accounting for 31%, or 36.6 Bcf/d, of marketed natural gas production. Production growth in the Appalachia region has been slowing in recent years because of limited pipeline takeaway capacity to transport natural gas to demand markets. On June 2024, the Federal Energy Regulatory Commission authorized the Mountain Valley Pipeline to begin operations. With this new capacity addition and the higher Henry Hub prices in 2025 relative to the previous year, production in the Appalachia grew by 1.1 Bcf/d in 2025 compared with the increase of just 46 million cubic feet per day Bcf/d in 2024.
The Permian region in Texas and New Mexico accounted for 23% of the marketed natural gas production in the United States in 2025 and around half the growth in U.S. production. In 2025, marketed natural gas production in the Permian region rose by 11%, or 2.7 Bcf/d, to average 27.7 Bcf/d.
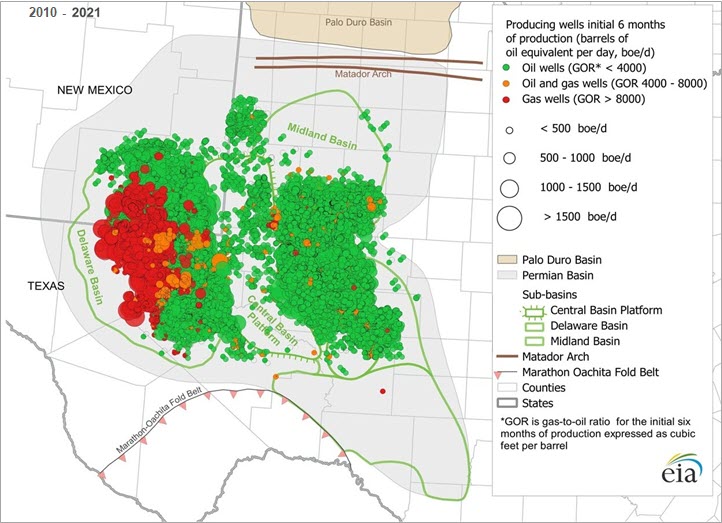
In the Permian region, growth in natural gas production is primarily the result of associated gas produced during oil production. West Texas Intermediate (WTI) crude oil prices fell from $77/barrel (b) in 2024 to $65/b in 2025. This price continued to support oil-directed drilling in the Permian region. Oil industry executives responding to the Dallas Fed Energy survey report the two largest basins in the Permian had breakeven prices of $61/b (Midland Basin) and $62/b (Delaware Basin) in 2025. Additionally, the average gas-to-oil ratio, which has been steadily increasing in the Permian, contributed to natural gas growth.
In 2025, production in the Haynesville region, which spans Louisiana and Texas, averaged 14.9 Bcf/d, 4% more than the 2024 annual average. The Henry Hub price increase from 2024 to 2025 allowed drilling in the Haynesville region to remain economical even with relatively deeper and more expensive well development costs. The Haynesville formation is between 10,500 feet to 13,500 feet deep compared with wells that average 4,000 feet to 8,500 feet deep in the Appalachia region. But the Haynesville’s proximity to liquefied natural gas export terminals and major industrial natural gas consumers along the U.S. Gulf Coast draws operators to the region.
Principal contributor: Naser Ameen
Tags: natural gas, production/supply, Permian