U.S. Energy Information Administration logo
Skip to sub-navigation
In-brief analysis
July 22, 2026

Commercial crude oil inventories increased by 2.0 million barrels
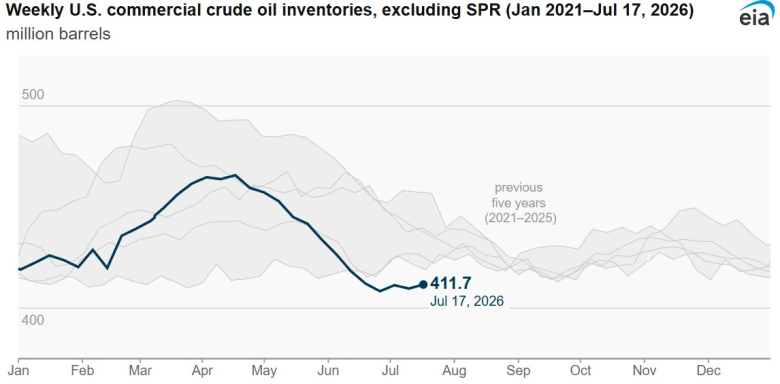
Net daily interchange between NYISO and Canada, Jan 1-Jul 13, 2026

Data source: U.S. Energy Information Administration, Weekly Petroleum Status Report
Note: Commercial crude oil inventories do not include crude oil in the Strategic Petroleum Reserve (SPR).

For the week ending July 17, 2026, commercial crude oil inventories (excluding the Strategic Petroleum Reserve) increased 2.0 million barrels to 411.7 million barrels, 6% below the previous five-year (2021–2025) average. Gasoline inventories increased 0.8 million barrels, 7% below the five-year average. Distillate inventories increased 1.4 million barrels, 10% below the five-year average. Propane/propylene inventories increased 6.3 million barrels, 34% above the five-year average. Total commercial petroleum inventories increased by 11.6 million barrels for the week.
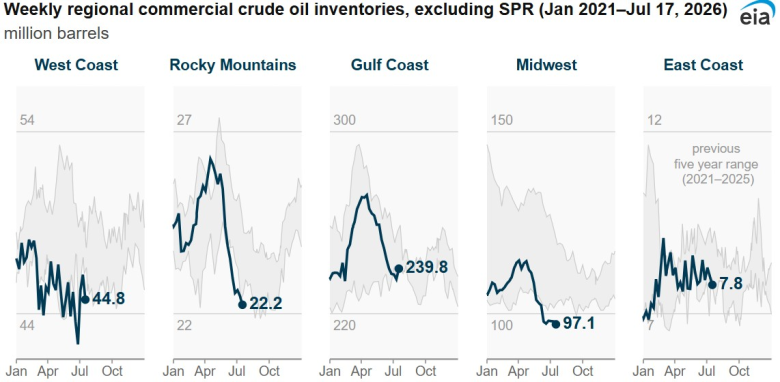
Weekly regional commercial crude oil inventories, excluding SPR (Jan 2021-Jul 17, 2026)
Data source: U.S. Energy Information Administration, Weekly Petroleum Status Report
Note: Commercial crude oil inventories do not include crude oil in the Strategic Petroleum Reserve (SPR).

U.S. refineries operated at 96.1% capacity utilization, processing 17.1 million barrels per day (b/d), down 58,000 b/d from the previous week. Gasoline output averaged 9.7 million b/d, and distillate production increased to 5.3 million b/d.

Crude oil imports increased 117,000 b/d to 5.8 million b/d, although the four-week average of 5.6 million b/d is 11% less than a year ago. Gasoline imports averaged 494,000 b/d; distillate imports averaged 173,000 b/d.

Over the past four weeks, total product demand averaged 20.4 million b/d, down 1% year over year. Gasoline demand increased 1% to 8.9 million b/d, while distillate demand increased 2% to 3.7 million b/d. Jet fuel demand increased 9% year over year. The increase demand for transportation fuels was offset by decreasing demand in residual fuel oil, propane, and other oils.
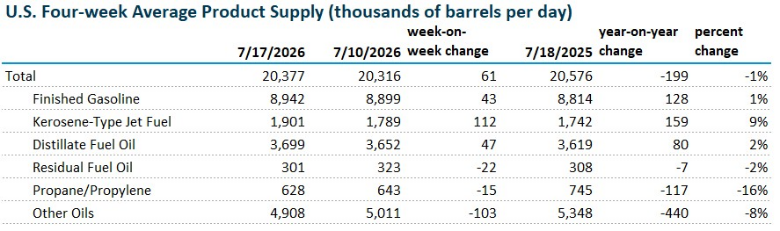
U.S. Four-week average product supply (thousands of barrels per day)

Principal contributors: EIA Staff

Statistics
Analysis
Tools
Education
News

Petroleum & Other Liquids

Crude oil, gasoline, heating oil, diesel, propane, and other liquids including biofuels and natural gas liquids.

Natural Gas

Exploration and reserves, storage, imports and exports, production, prices, sales.

Electricity

Sales, revenue and prices, power plants, fuel use, stocks, generation, trade, demand & emissions.

Coal

Reserves, production, prices, employment and productivity, distribution, stocks, imports and exports.

Nuclear & Uranium

Uranium fuel, nuclear reactors, generation, spent fuel.

Renewable & Alternative Fuels

Includes hydropower, solar, wind, geothermal, biomass and ethanol.

EIA Survey Forms

Forms EIA uses to collect energy data including descriptions, links to survey instructions, and additional information.

Total Energy

Comprehensive data summaries, comparisons, analysis, and projections integrated across all energy sources.

U.S. States

State energy information, including overviews, rankings, data, and analyses.

International

International energy information, including overviews, rankings, data, and analyses.

Environment

Greenhouse gas data, voluntary reporting, electric power plant emissions.

Data Tools, Apps, & Maps

Tools to customize searches, view specific data sets, study detailed documentation, and access time-series data.

Open Data

EIA's free and open data available as API, Excel add-in, bulk files, and widgets

EIA Beta

Come test out some of the products still in development and let us know what you think!

Open Source Code

EIA's open source code, available on GitHub.

RSS Feeds

Subscribe to feeds for updates on EIA products including Today in Energy and What's New.