
China’s nuclear power capacity nearly doubled since 2016
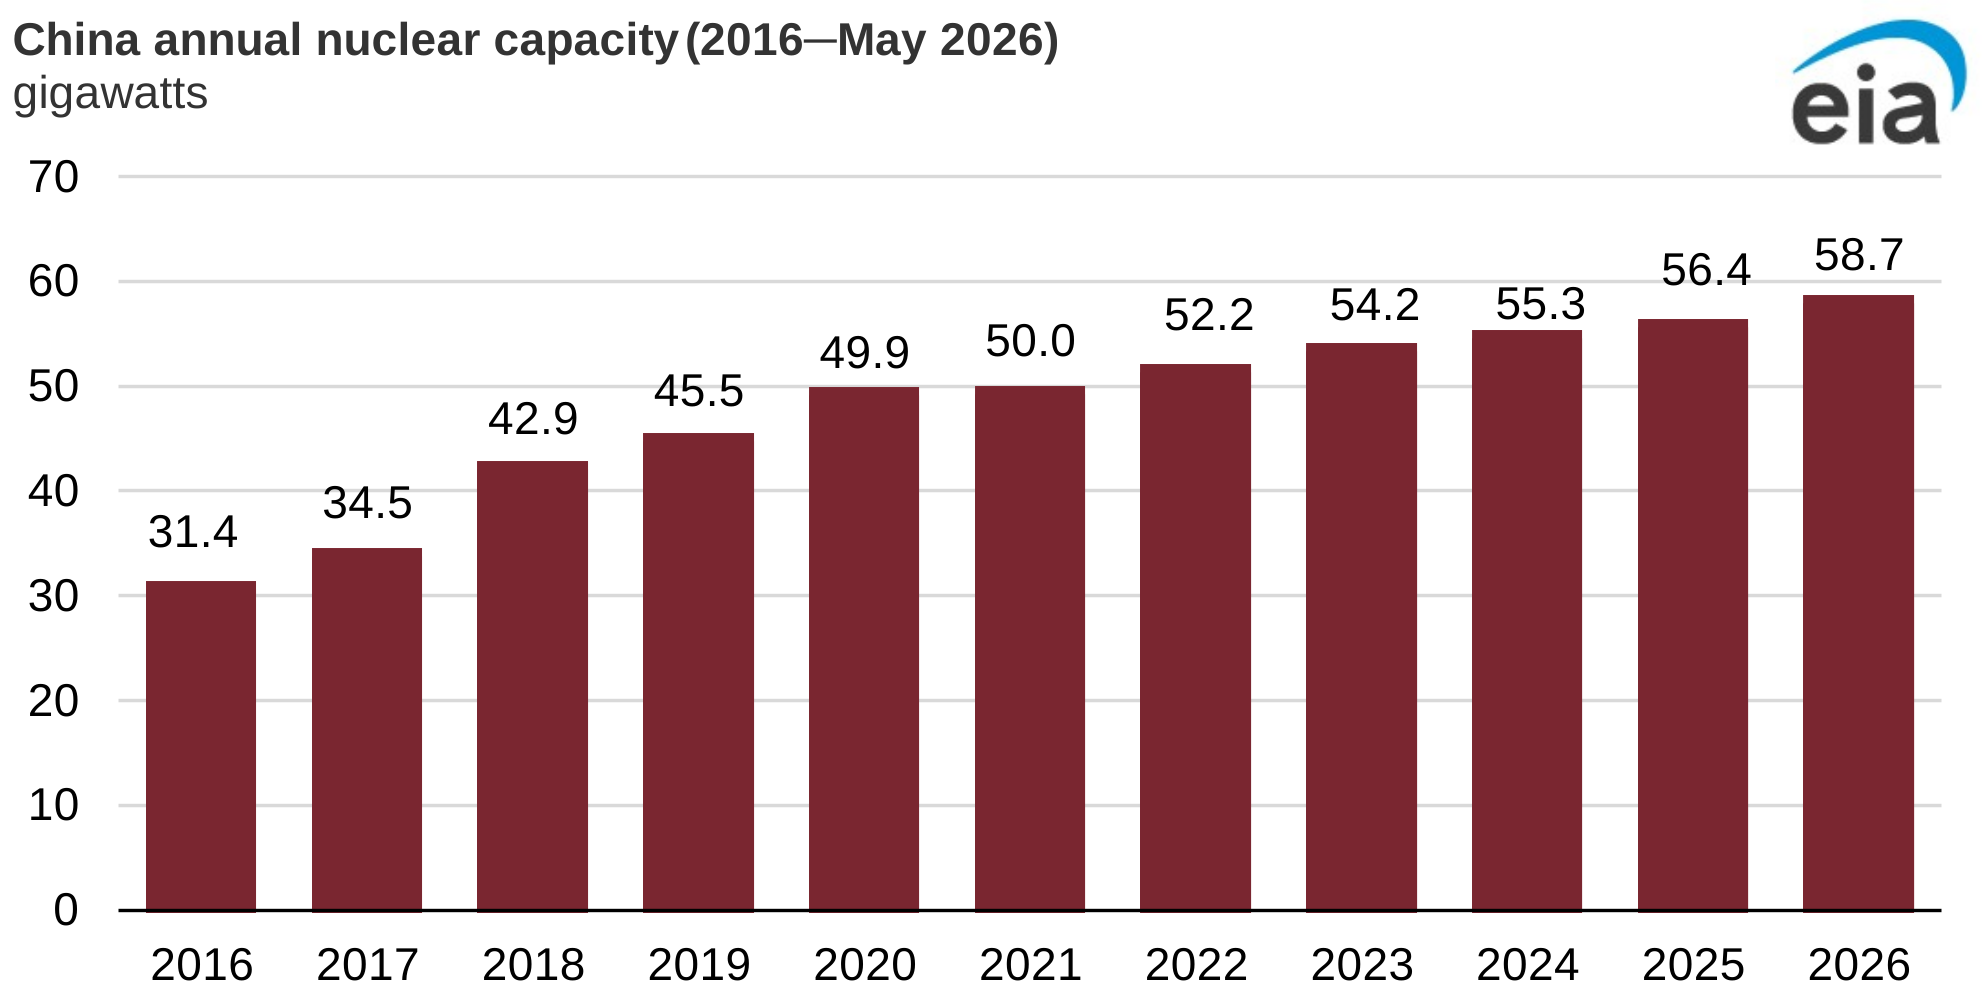
Note: IAEA data are used to identify capacity additions in 2025 and 2026, which we then add to our International Energy Statistics estimate for 2024 to get the total capacities for 2025 and 2026. All values are in reference unit power.
From 2016 to 2024, China’s nuclear generation capacity increased 76% (24 GW), based on our International Energy Statistics (IES) data. According to the International Atomic Energy Agency’s Power Reactor Information System (PRIS), China added an additional 1.1 GW of nuclear power capacity in 2025 and 2.2 GW in 2026 (through May). China is continuing to build out its nuclear generating capacity and has 36 reactors under construction, accounting for more than 49% of total world nuclear construction, according to PRIS.
China’s nuclear fleet is concentrated near population centers in the eastern part of the country, along the Pacific Ocean coastline from the Liaoning province in the north to the Hainan province in the south. According to IAEA’s PRIS, China’s existing nuclear fleet mostly consists of pressurized water reactors.
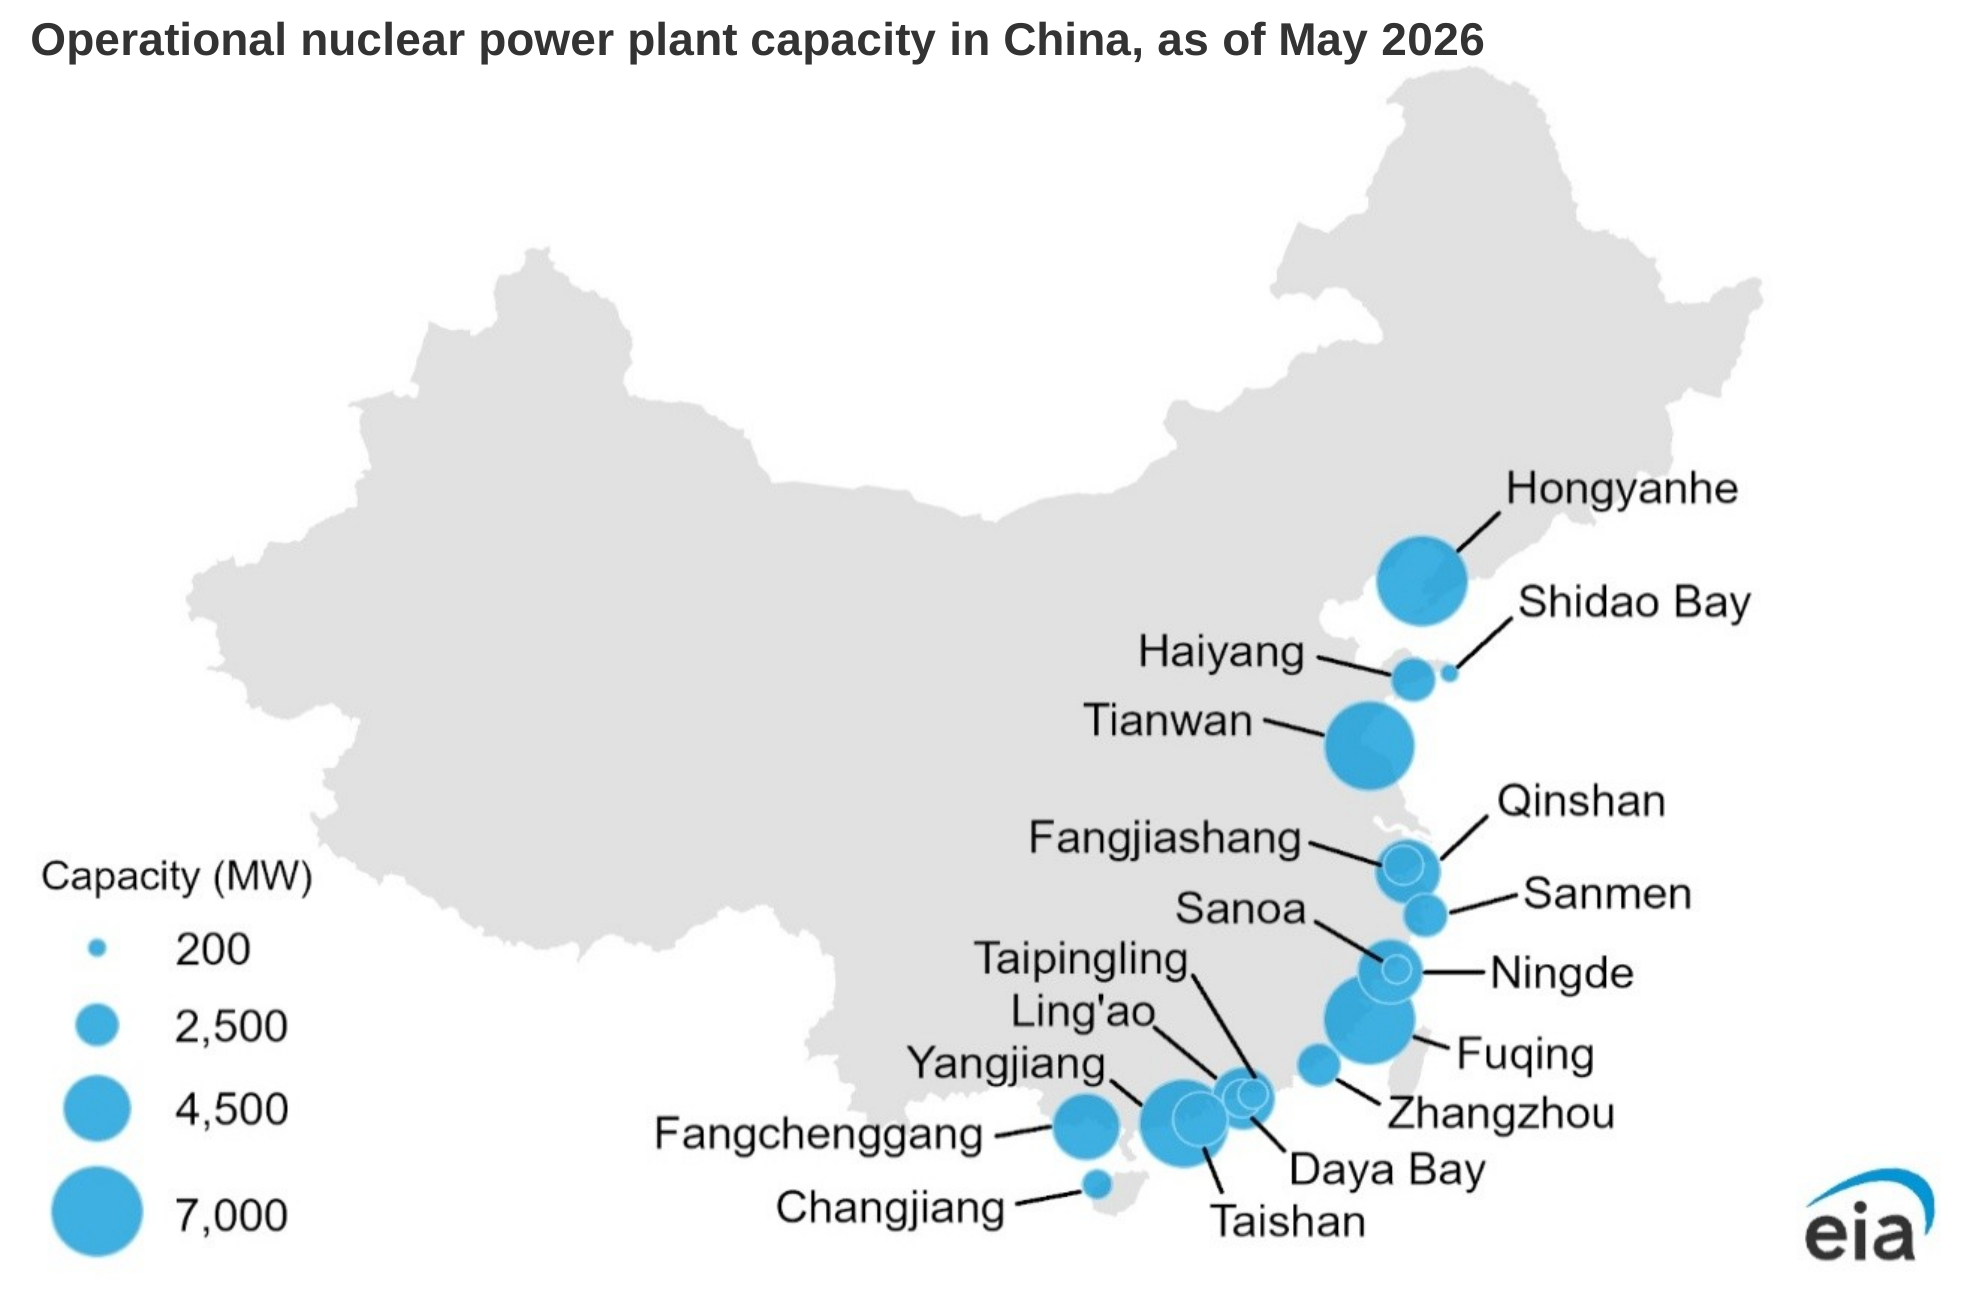
Note: MW=megawatts
As of May 2026, China had 60 operational reactors with 58.7 GW of total capacity installed at 18 different sites. China has also implemented strategies to help rapidly expand its nuclear power plant fleet.
Nuclear projects in China use a standardized project management approach for design, licensing, and construction for multiple reactor technologies. Reactors are built in batches of 6 to 10 reactors to take advantage of economies of scale. China is also building up a nuclear supply chain with a focus on domestic manufacturing of the main plant components to decrease reliance on foreign nuclear vendors.
Additionally, China’s average build time for nuclear power plants is below the global average. According to the World Nuclear Industry Status Report, 2022 the average build time for a nuclear power plant in China between 2012 and 2021 was six years, compared with a global average construction time of about nine years. More recent reporting in 2024 similarly indicates that Chinese firms built reactors both inside and outside of China in five to seven years.
China started construction of six new reactors in 2025 and two new reactors, Xuwei-1 and Taipingling-4 in 2026 through May. China has also commissioned two new units so far in 2026: Sanao-1 and Taipingling-1. In total, China has 36 reactors under construction across 19 sites which will add about 38.9 GW of additional capacity.
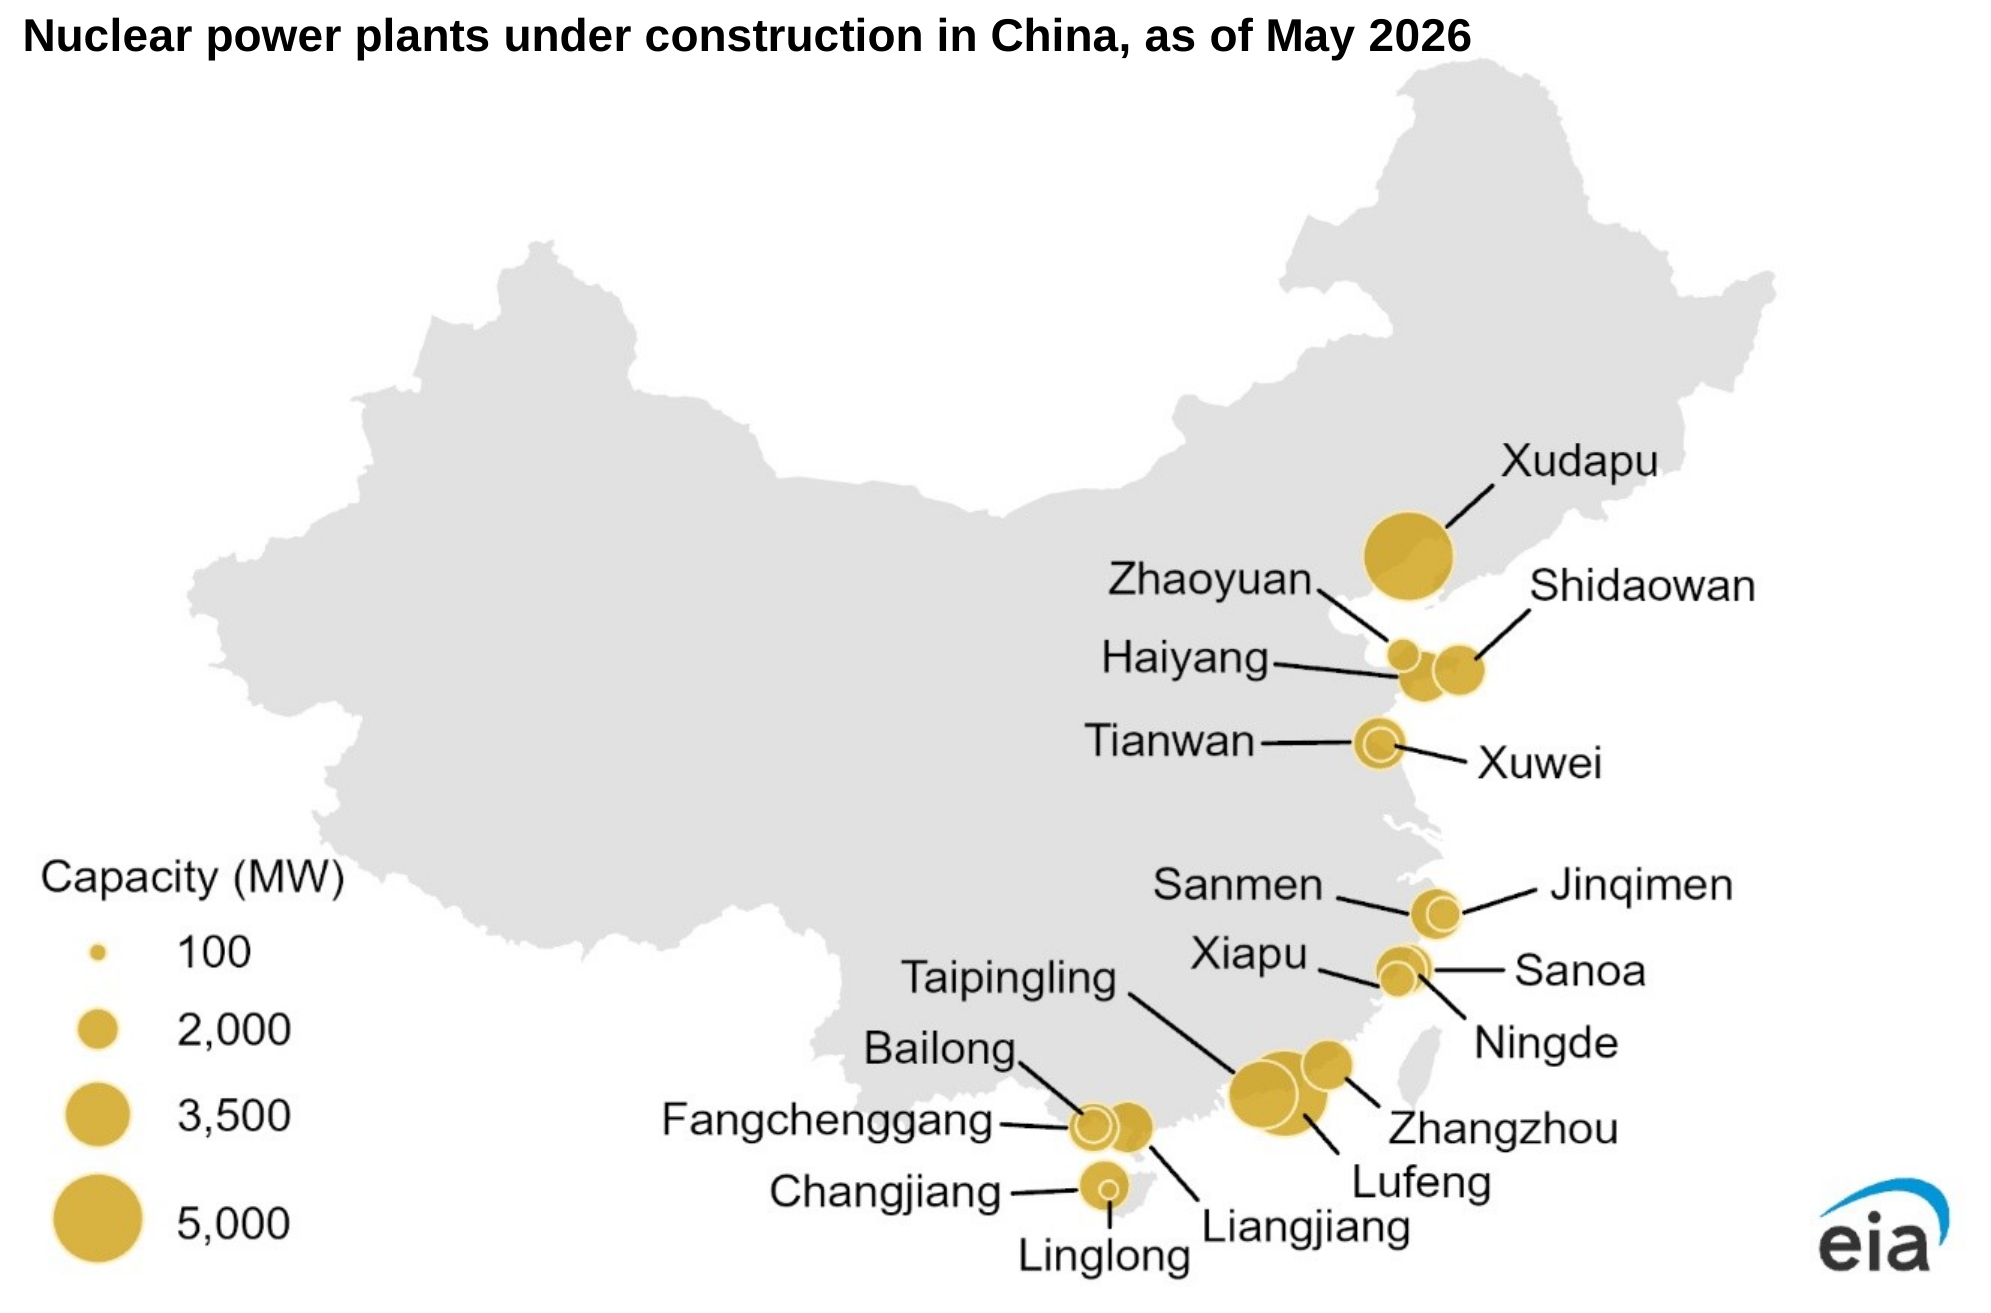
Note: MW=megawatts
China is building its first small modular reactor (SMR), the Linglong-1, a domestically designed 100 MWe pressurized water reactor that can be used for power generation, water desalination, and district heating. The project is intended to demonstrate commercial operation and is expected to start operation in the first half of 2026. The Linglong-1 uses the ACP100 SMR design, a modular design, allowing certain components to be built in a factory and installed onsite.
You can find more information about energy in China in EIA’s Country Analysis Brief on China.
Principal contributors: Slade Johnson, Jonathan Russo