
U.S. natural gas storage capacity increased slightly in 2025
Note: Measures of capacity reflect final revised values as published in the Underground Natural Gas Working Storage Capacity Report.
Underground working natural gas storage capacity in the Lower 48 states increased slightly in 2025, according to our latest data, with growth concentrated in the South Central and Mountain regions. Underground natural gas storage provides a source of energy when demand increases, balancing U.S. energy needs. We calculate natural gas storage capacity in two ways: demonstrated peak capacity and working gas design capacity. Both increased in 2025.
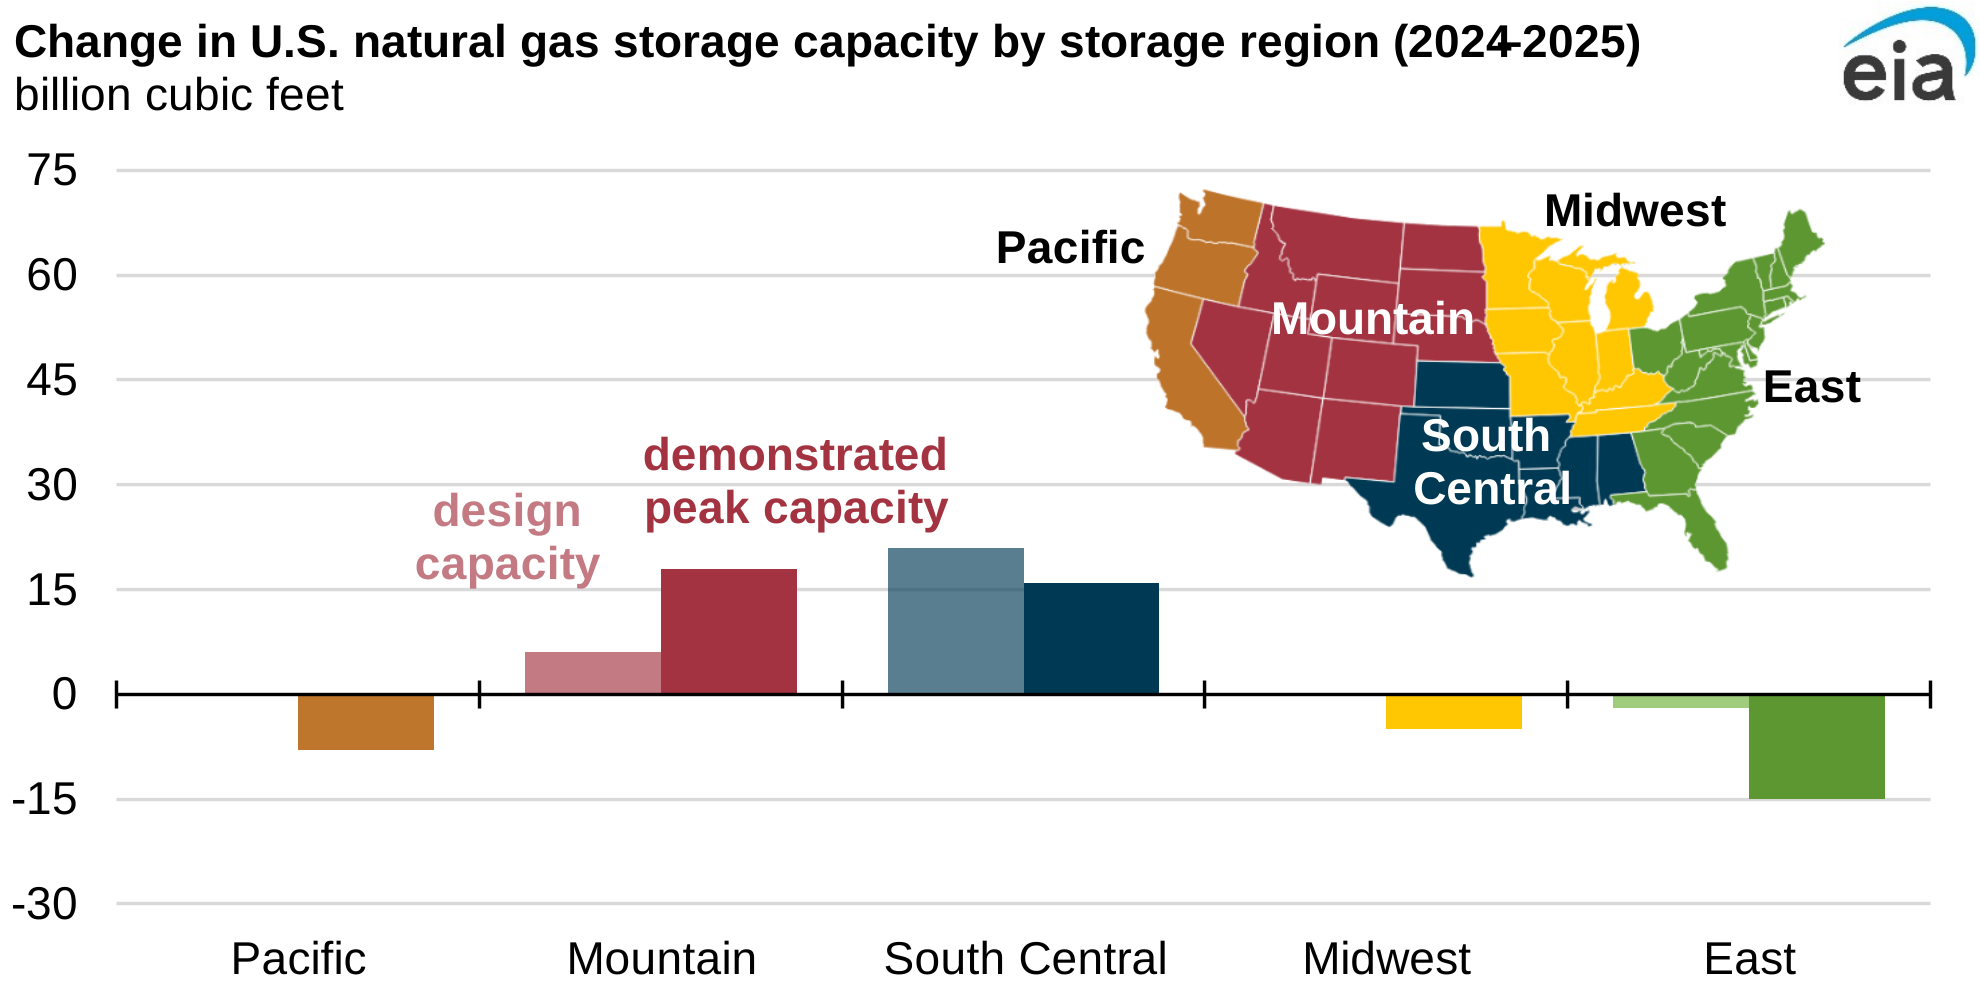
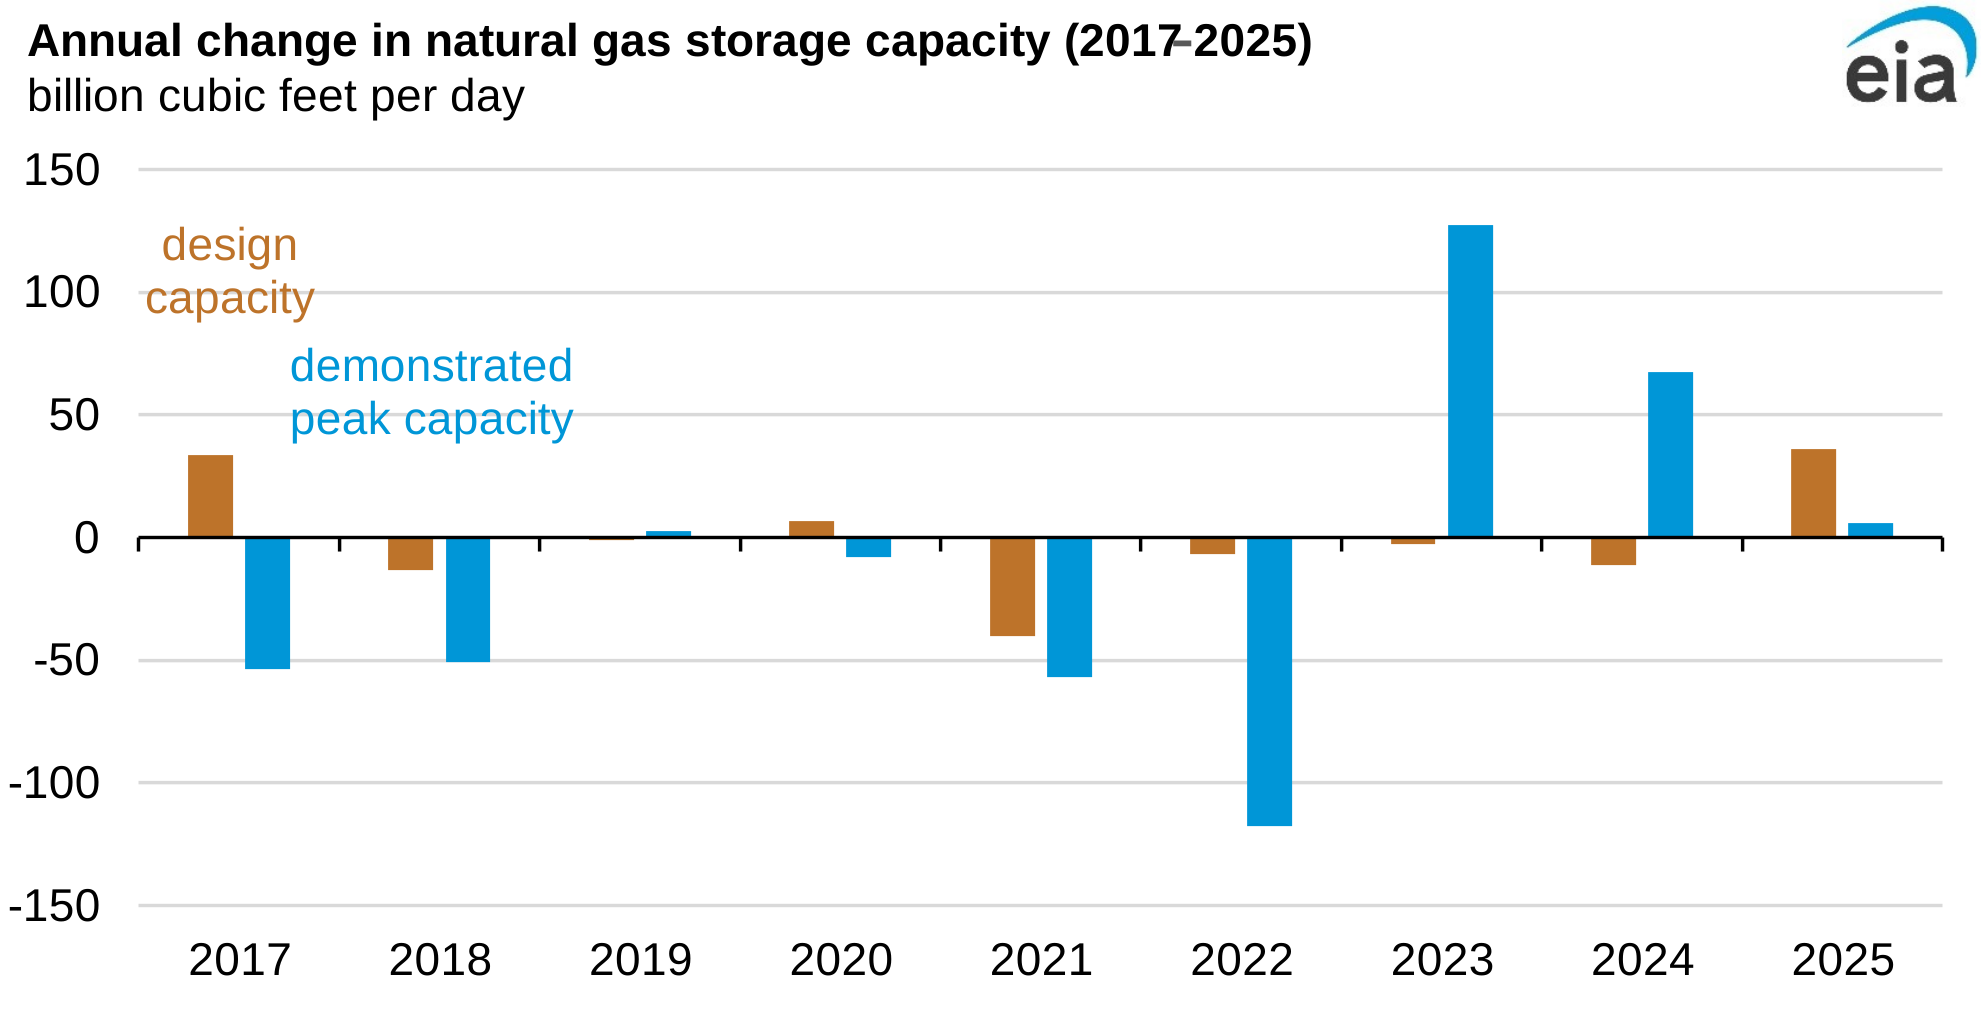
Demonstrated peak capacity is the sum of the largest volume of working gas stored in each storage field during the previous five-year period, regardless of when the peaks occurred. Demonstrated peak capacity for the Lower 48 states rose 0.1%, or 6 billion cubic feet (Bcf), in 2025, increasing for the third year in a row. In the last three years, use of both existing storage facilities and new storage facilities has increased. Demonstrated peak capacity increased by 16 Bcf and 18 Bcf in the South Central and Mountain storage regions, respectively. Meanwhile, demonstrated peak capacity in the Midwest region decreased by 5 Bcf; the Pacific region by 8 Bcf; and the East region by 15 Bcf. Demonstrated peak capacity is typically less than working gas design capacity because it relates to actual usage rather than potential capacity based on the design of the facility.
Design capacity, sometimes referred to as nameplate capacity, is based on the physical characteristics of the reservoir, installed equipment, and operating procedures on the site, which federal or state regulators usually must certify. As of November 2025, the design capacity of underground natural gas storage facilities in the Lower 48 states rose by 26 Bcf to 4683 Bcf compared with the previous year. The South Central and Mountain regions reported the largest capacity additions in the Lower 48 states. Working gas design capacity increased 21 Bcf in the South Central region and 6 Bcf in the Mountain region. Working gas design capacity declined 2 Bcf in the East region primarily due to base gas adjustments in the region. Working gas design capacity in the Pacific and Midwest regions remained unchanged from the previous year.
Note: Measures of capacity reflect final revised values as published in the Underground Natural Gas Working Storage Capacity Report.
Principal contributor: Jose Villar
Tags: natural gas, storage capacity