
U.S. natural gas consumption set a monthly and yearly record in 2025
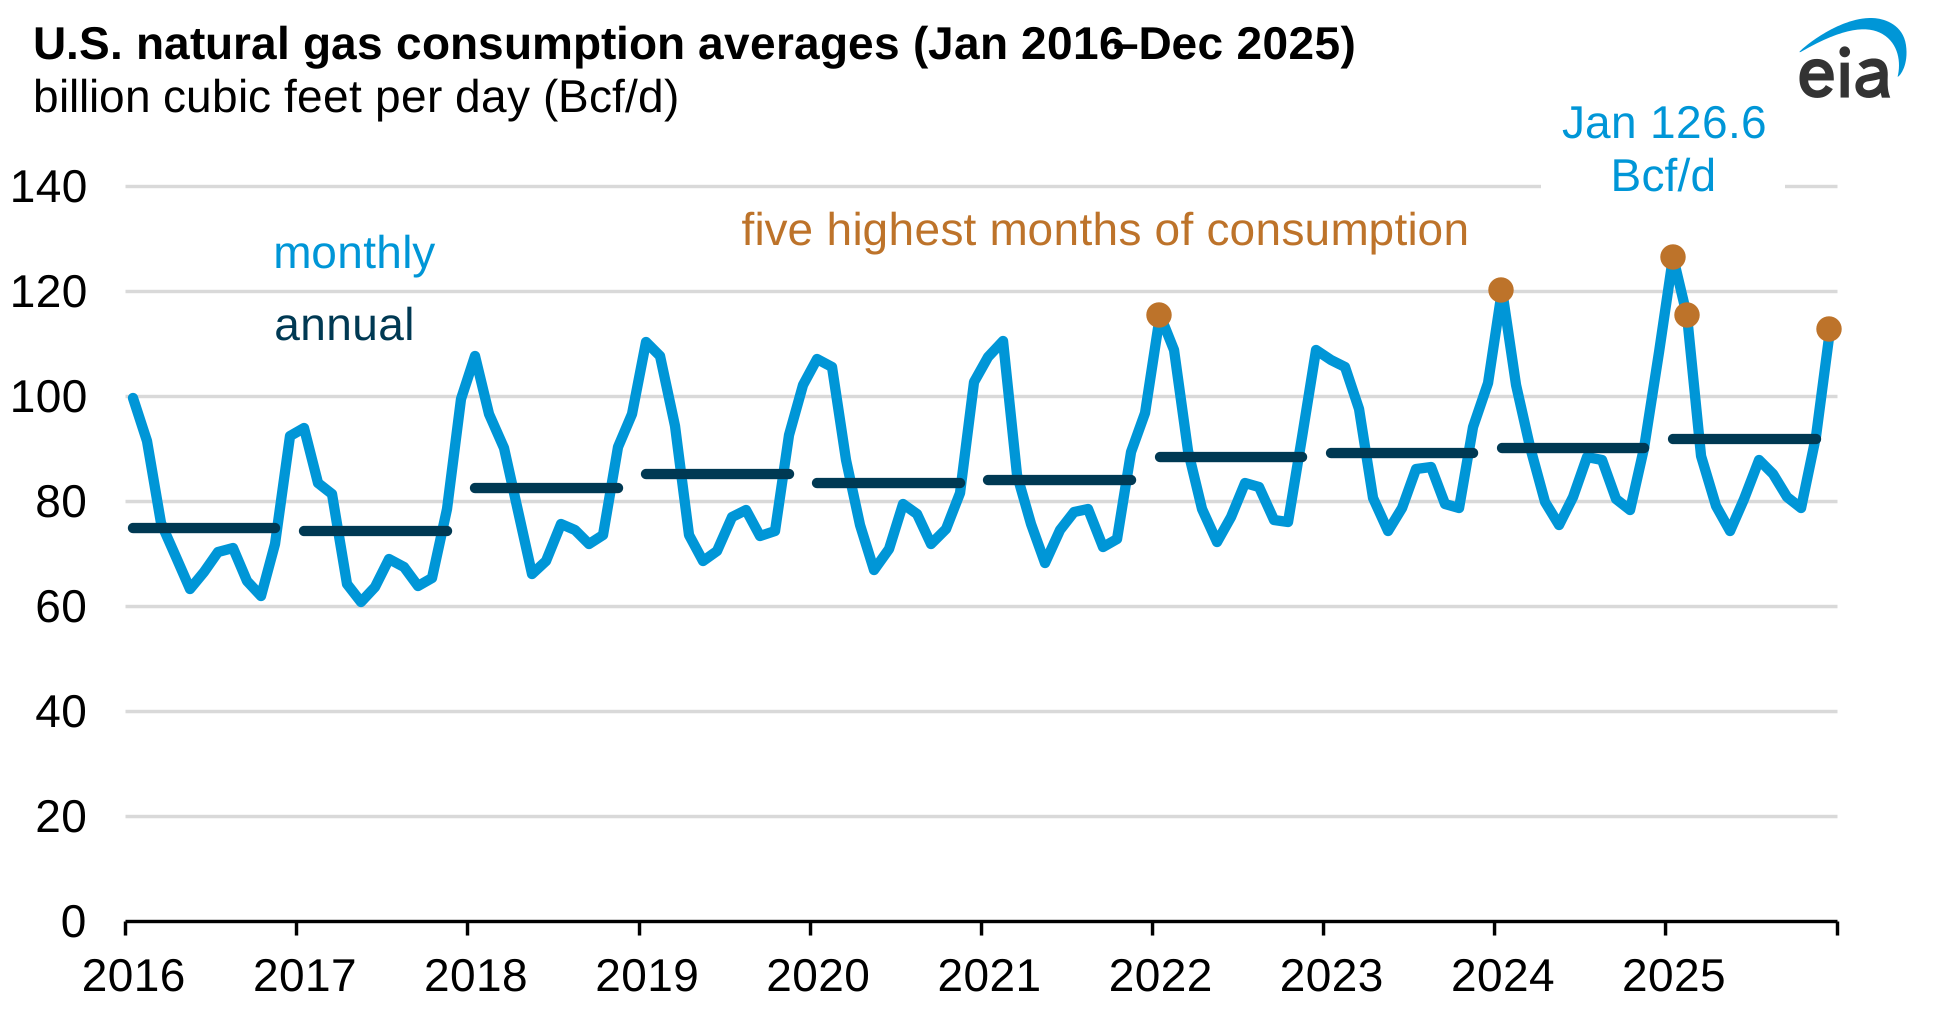
U.S. natural gas consumption averaged a record 92.0 billion cubic feet per day (Bcf/d) in 2025 and set a new winter monthly record of 126.6 Bcf/d in January 2025, according to data in our Natural Gas Monthly. Overall, U.S. natural gas consumption last year increased 2% (1.7 Bcf/d) from 2024. In January 2025, natural gas consumption was up 5% (6.3 Bcf/d) compared with January 2024.
U.S. natural gas consumption typically peaks during the winter heating season (November–March), when colder temperatures increase demand for space heating in the residential and commercial sectors. The top five months of record-high consumption since 1998 all occurred during these winter months because of sustained cold weather.
As heating degree days increase, demand for space heating rises leading to higher total consumption. Colder conditions can also contribute to higher natural gas usage in the electric power sector when electricity demand from electric heat pumps and resistance heaters increases and natural gas-fired generation helps meet peak winter electricity loads.
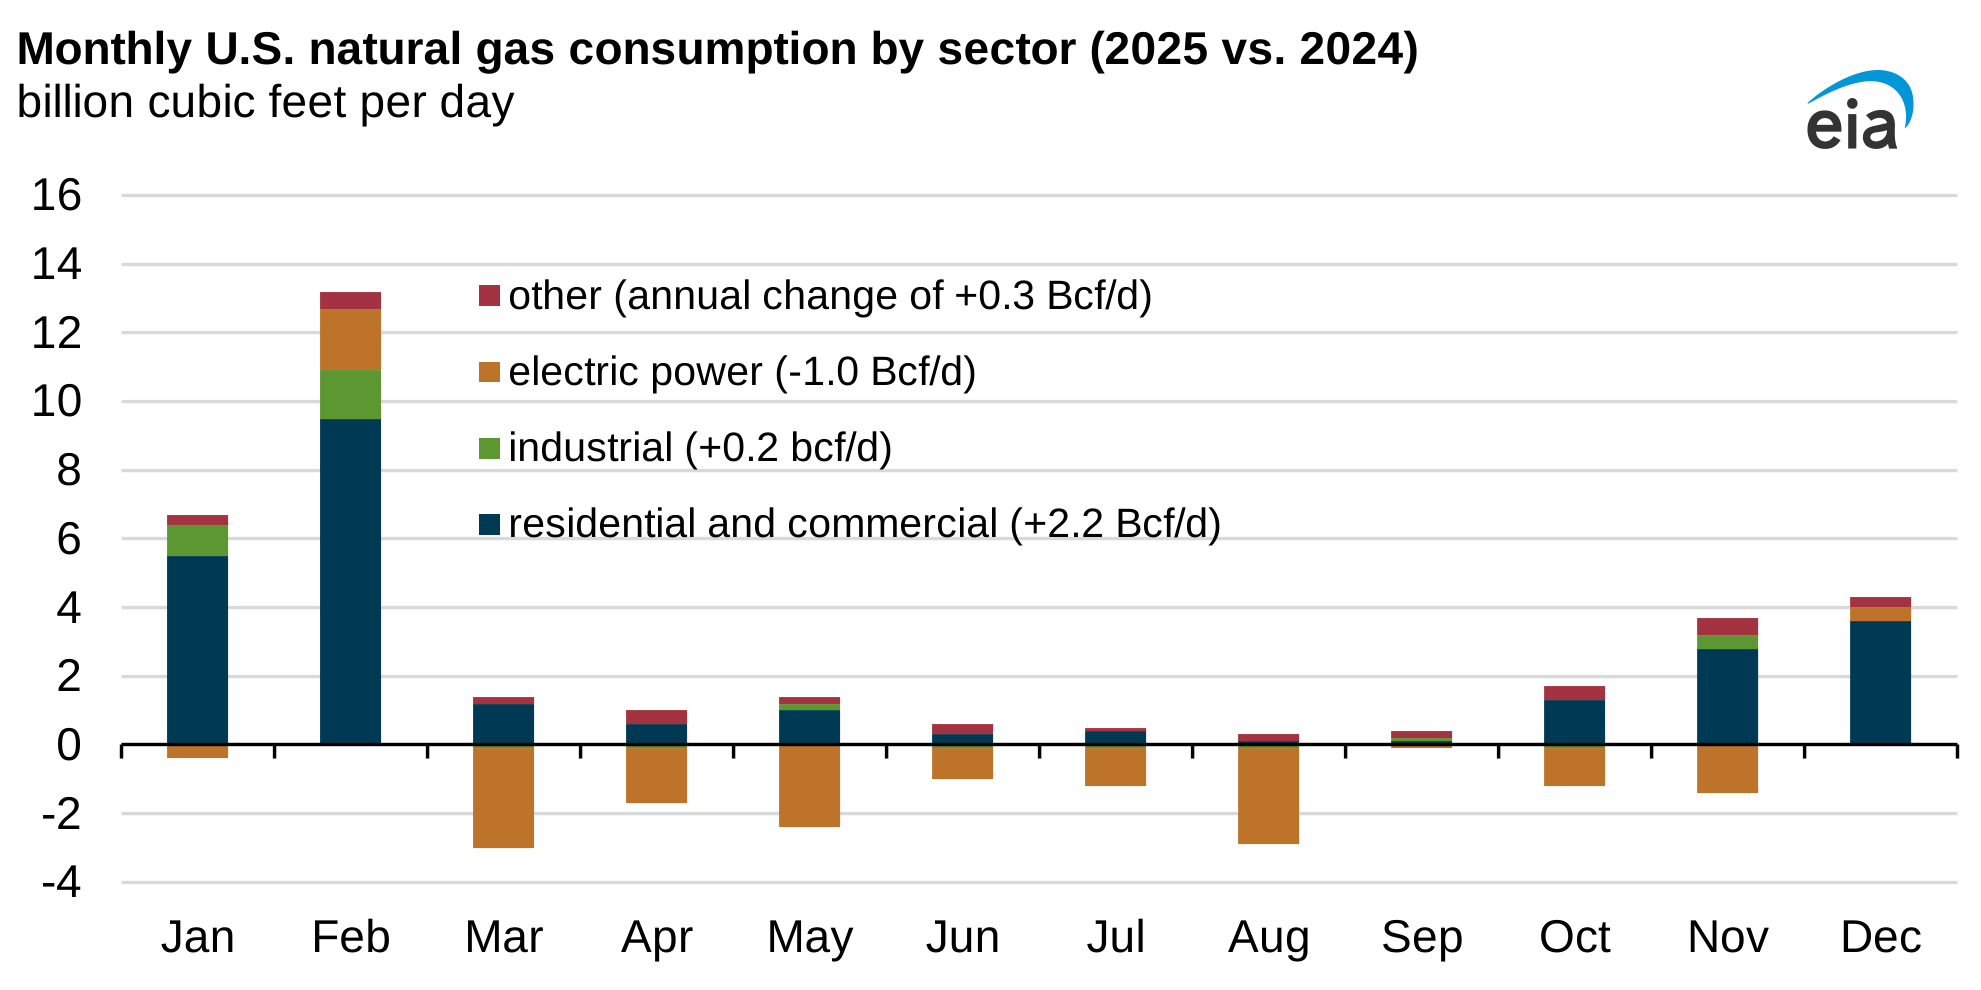
Changes in U.S. natural gas consumption in 2025 varied by sector. Residential and commercial consumption accounted for most of the year-over-year increase, particularly during the first quarter. In February 2025, combined residential and commercial consumption was 9.5 Bcf/d higher than in February 2024, which was one of the warmest February’s on record. In 2025, annual residential consumption averaged 13.3 Bcf/d, 11% more than 2024, and commercial consumption averaged 9.9 Bcf/d, 10% more, reflecting colder winter conditions in 2025. The change in industrial consumption was less pronounced, increasing by 0.2 Bcf/d compared with 2024.
By contrast, natural gas consumption in the electric power sector decreased across most of the year compared with 2024. The United States also registered 73 fewer cooling degree days over the summer months (May–August) in 2025. The decline in electric power consumption of natural gas also reflected rapid solar and battery additions in 2025, which displaced natural gas-fired generation during many hours of the day. Electric power use declined the most in March and August, by 2.9 Bcf/d and 2.8 Bcf/d, respectively. Electric power usage typically peaks during the summer months when higher air-conditioning demand increases electricity generation, much of which is fueled by natural gas. On average in 2025, electric power demand for natural gas decreased 1.0 Bcf/d to 35.8 Bcf/d.
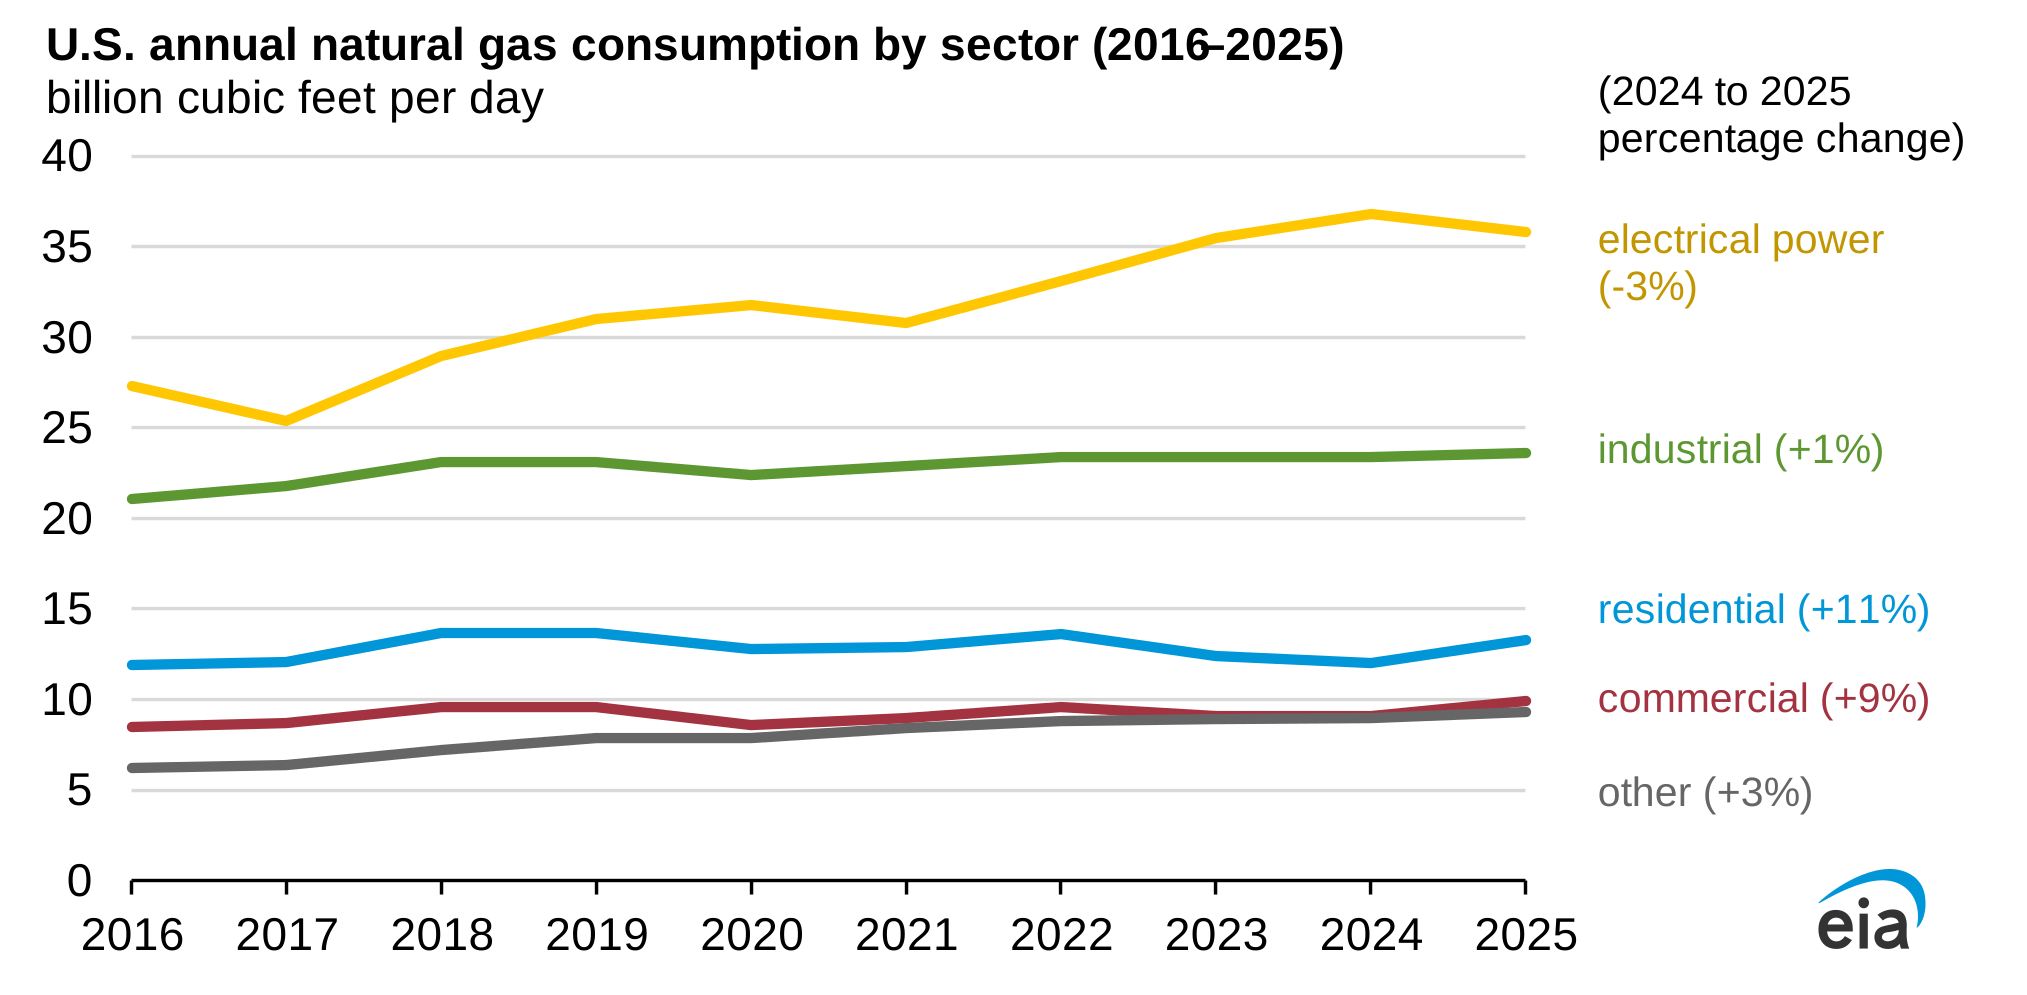
Despite the year-over-year decrease, electric power remains the largest consuming sector, and overall demand for natural gas power generation has trended upward over the last decade, increasing from 27.3 Bcf/d in 2016 to 35.8 Bcf/d in 2025. Residential and commercial consumption are more weather sensitive and show greater year-to-year variability over the past 10 years. Consumption by the industrial sector, the second-largest consumer of natural gas, has also grown steadily but at a lower rate compared with demand from the electric power sector over the past 10 years, increasing from 21.1 Bcf/d in 2016 to 23.6 Bcf/d in 2025.
Principal contributor: Andrew Iraola