
We expect Henry Hub natural gas spot prices to fall slightly in 2026 before rising in 2027
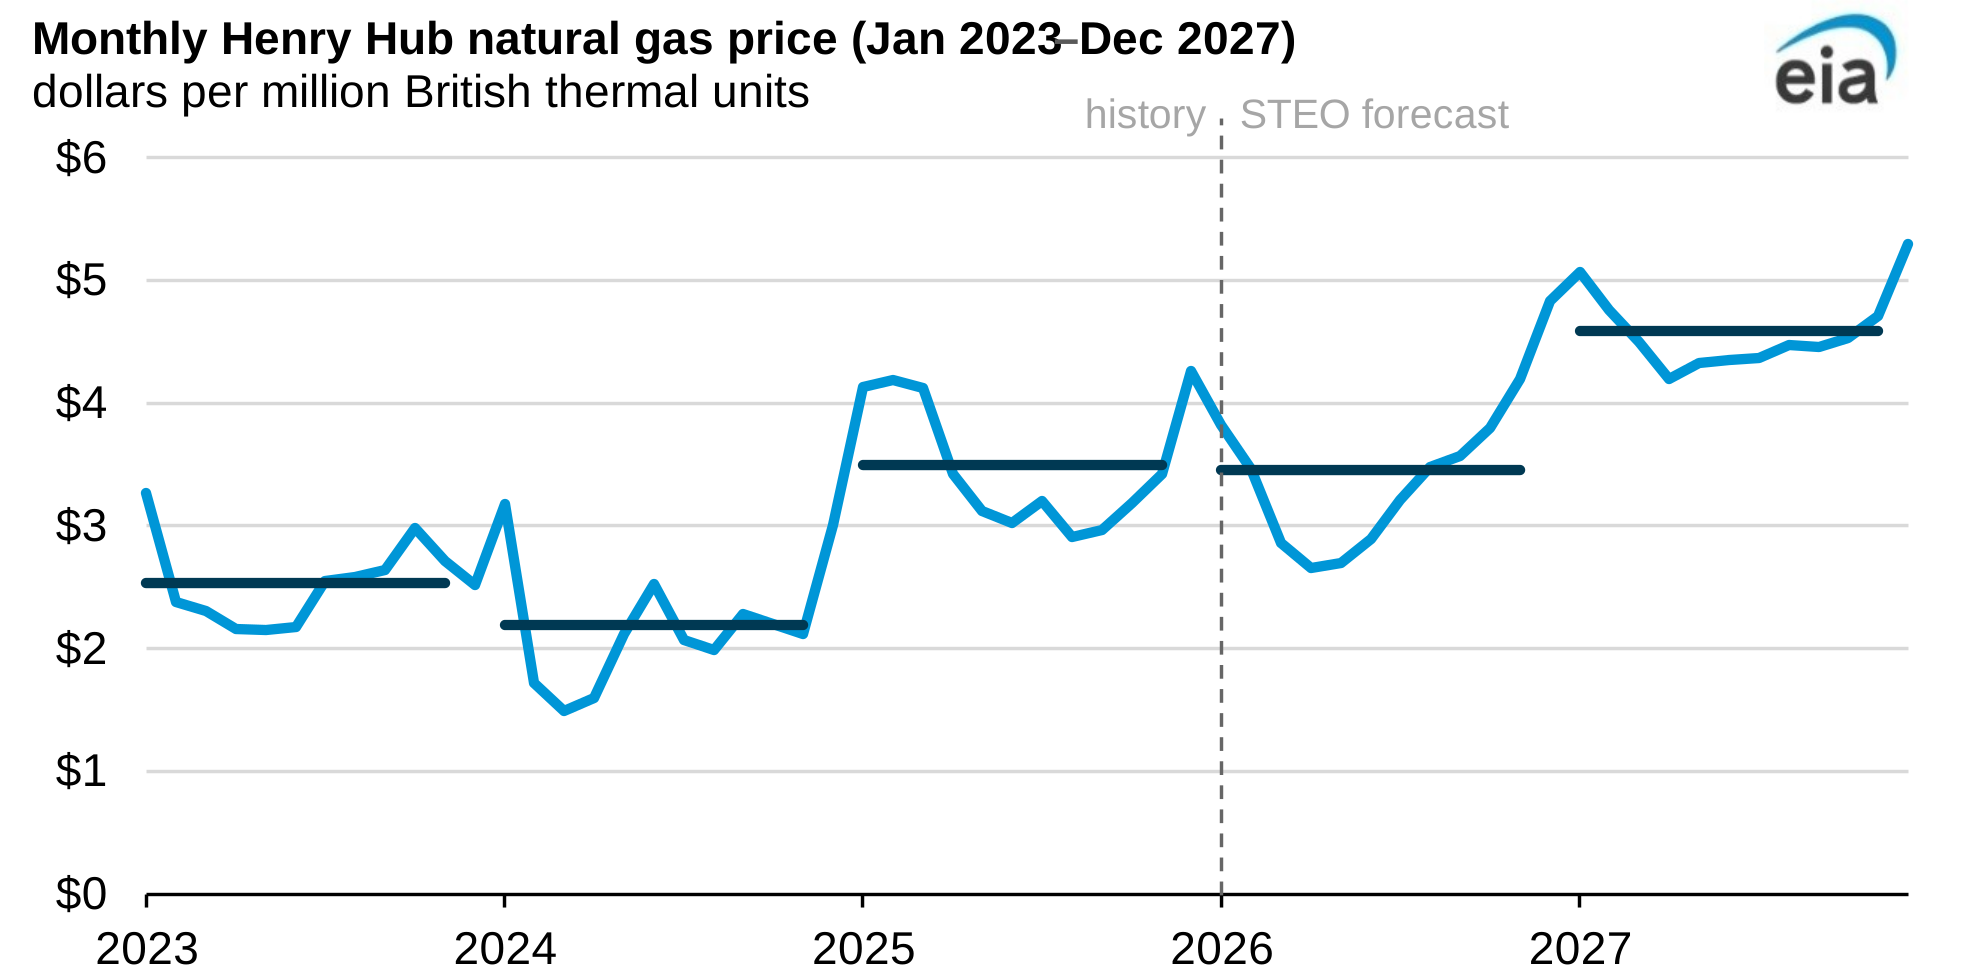
We expect the U.S. benchmark natural gas spot price at the Henry Hub to decrease about 2% to just under $3.50 per million British thermal units (MMBtu) in 2026 before rising sharply in 2027 to just under $4.60/MMBtu, according to our January Short-Term Energy Outlook (STEO). We expect the annual average Henry Hub price in 2026 to decrease slightly as annual supply growth keeps pace with demand growth over the year. However, in 2027, we forecast demand growth will rise faster than supply growth, driven mainly by more feed gas demand from U.S. liquefied natural gas (LNG) export facilities, reducing the natural gas in storage. We forecast annual average spot prices will decrease by 2% in 2026 and then increase by 33% in 2027.
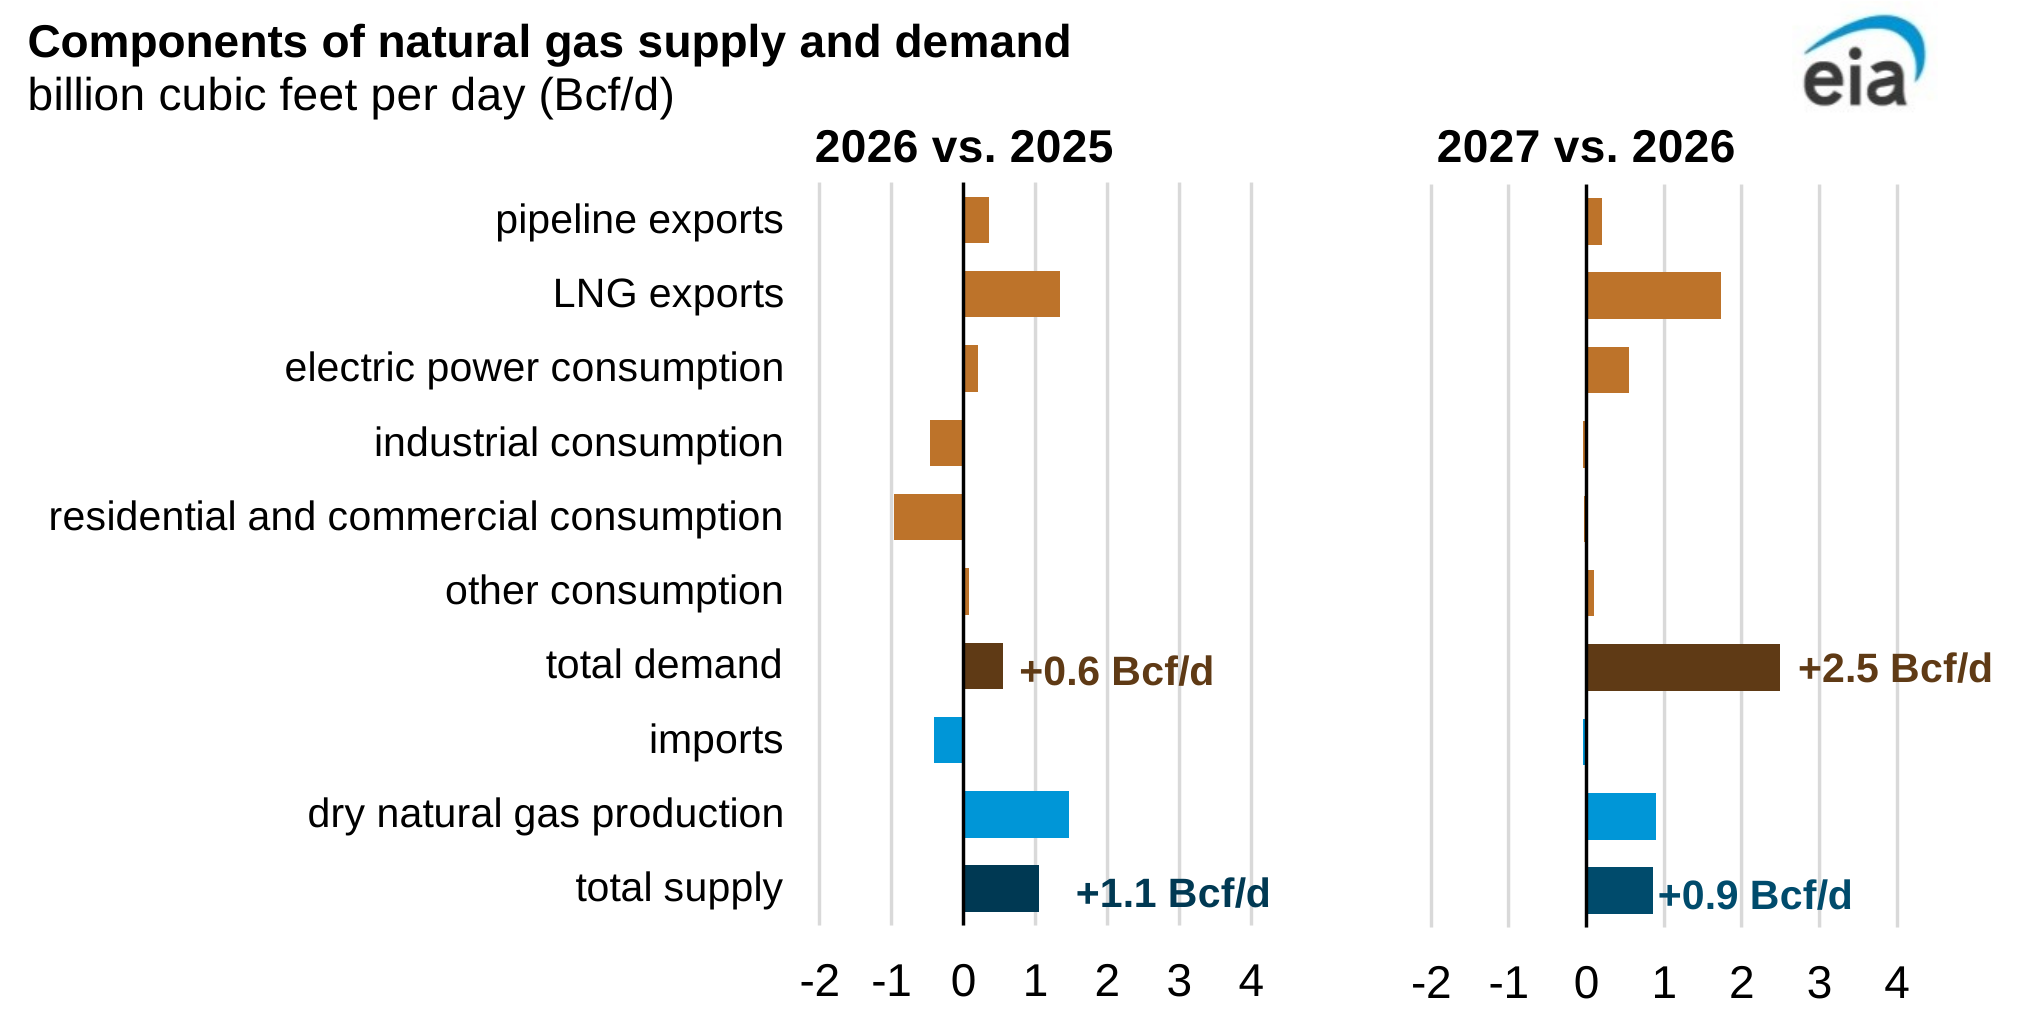
Forecast natural gas supply growth outpaces demand growth by 0.5 billion cubic feet per day (Bcf/d) in 2026 but then falls behind by 1.6 Bcf/d in 2027, putting upward pressure on natural gas prices. We expect demand in 2026, which includes exports, will increase by less than 1% (+0.6 Bcf/d) while supply, which includes imports, will increase by nearly 1% (+1.1 Bcf/d). We expect this difference to reverse in 2027 as demand growth (+2.5 Bcf/d) exceeds supply growth (+0.9 Bcf/d).
Demand increase driven by more LNG exports
LNG exports grow by a forecast 9% (1.3 Bcf/d) in 2026 and 11% (1.7 Bcf/d) in 2027. The increase is the result of the ramp-up of three new LNG export facilities: Plaquemines LNG, Corpus Christi Stage 3, and Golden Pass LNG. Plaquemines LNG and Corpus Christi Stage 3 will continue ramping up to full operations in our forecast period, and we expect Golden Pass LNG to begin operations in 2026.
Data values: U.S. Natural Gas Supply, Consumption, and Inventories
Note: LNG= liquefied natural gas
Our forecast for U.S. domestic consumption of natural gas remains relatively flat in both years, as decreases in consumption in the industrial, commercial, and residential sectors are offset by increases in consumption in the electric power sector. Natural gas consumption for electrical power generation increases steadily through the forecast, reflecting continued reliance on natural gas-fired generation to meet load growth and balance renewables.
Forecast consumption of natural gas in the residential and commercial sectors decreases 4% in 2026 to 22.1 Bcf/d. Our forecast for 2026 reflects closer-to-normal temperatures leading to less consumption compared with 2025, with its colder-than-normal weather conditions in certain winter months. Consumption of natural gas in the industrial sector decreases in 2026 and 2027 in our forecast because of closer-to-normal weather and decreased industrial activity, as measured by the natural gas-weighted manufacturing index.
Prices rise as storage balances decline
As natural gas demand outpaces supply, we expect storage inventories will gradually move below the rolling five-year average over our forecast. By comparison, storage levels had been relatively robust in 2024 and 2025, with inventories remaining 1.7% above the five-year (2020–24) average at the close of December 2025.
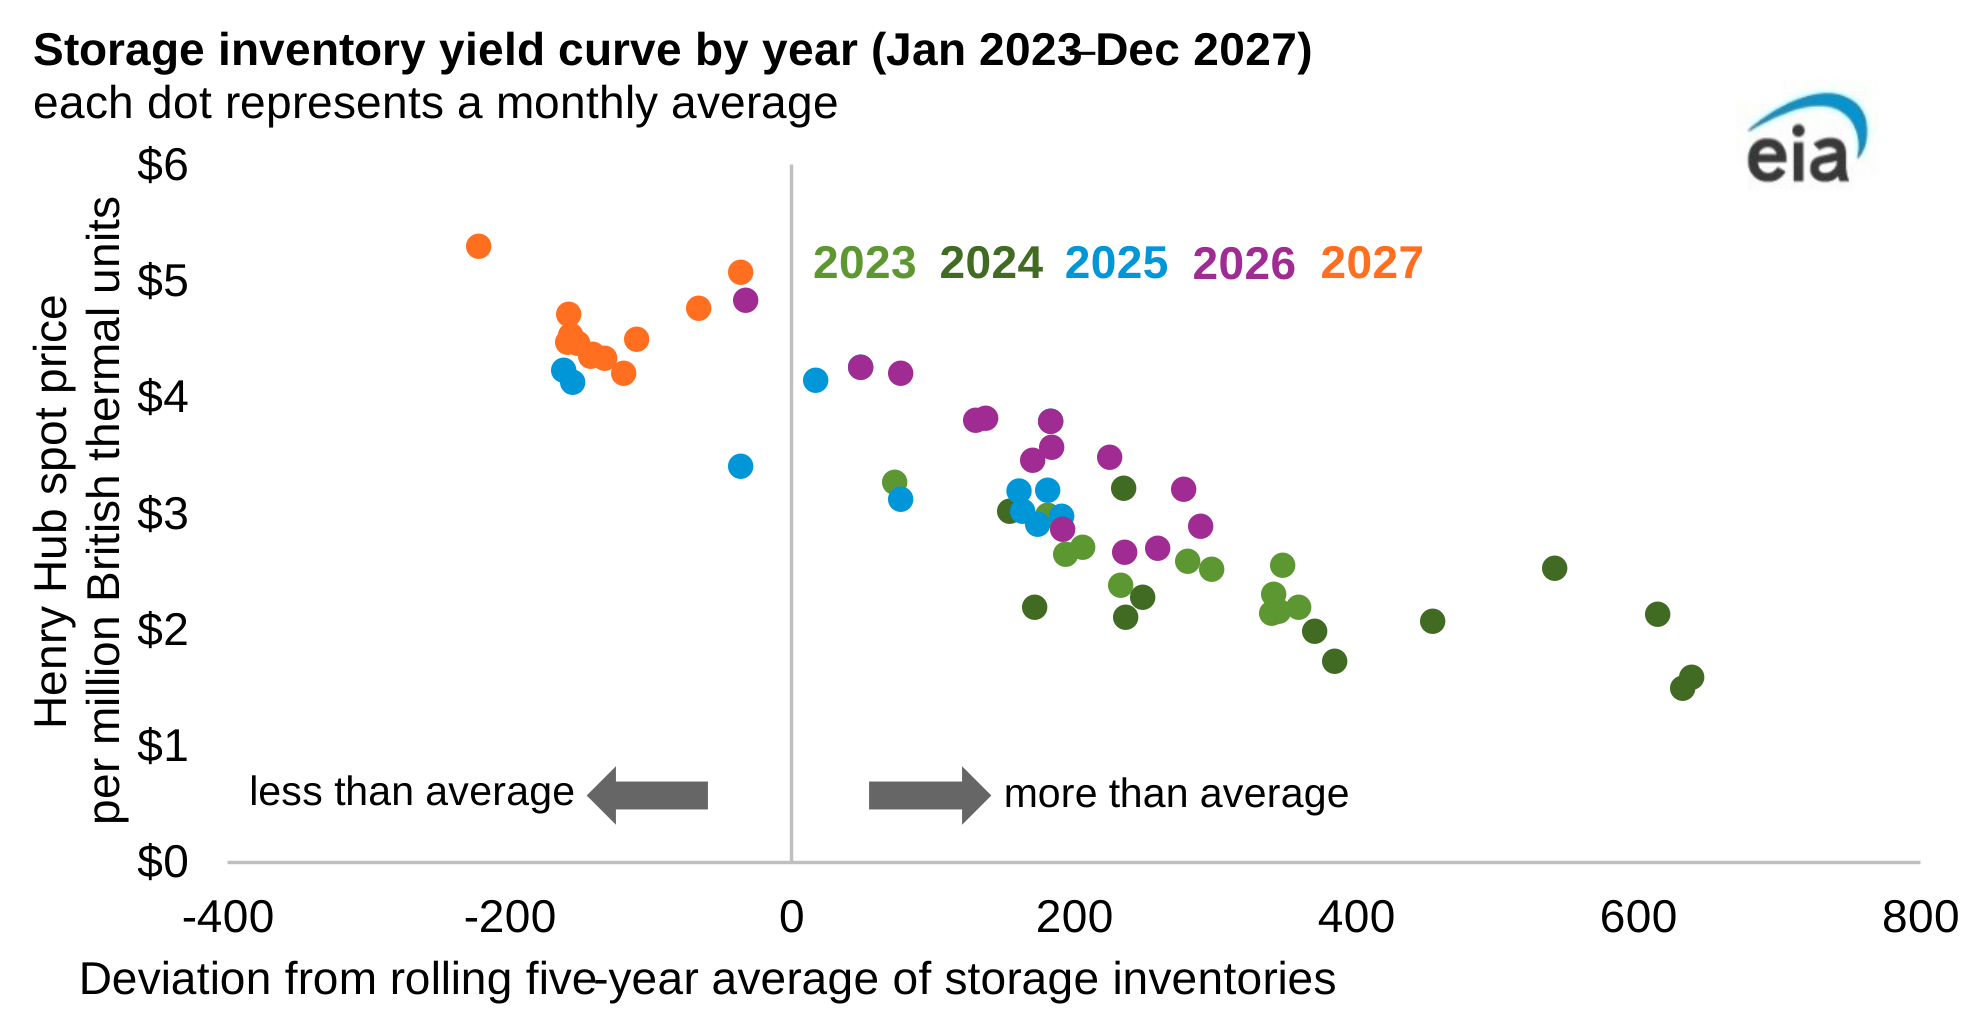
Periods with higher-than-average inventories are generally associated with lower prices, while lower storage levels correspond with higher prices and tighter market conditions. As inventories move closer to or below the five-year average, our forecasted price for Henry Hub rises, illustrating how storage levels remain a key indicator of natural gas market balance and price formation.
Principal contributor: Andrew Iraola