
U.S. natural gas inventories in underground storage ended winter at a three-year low
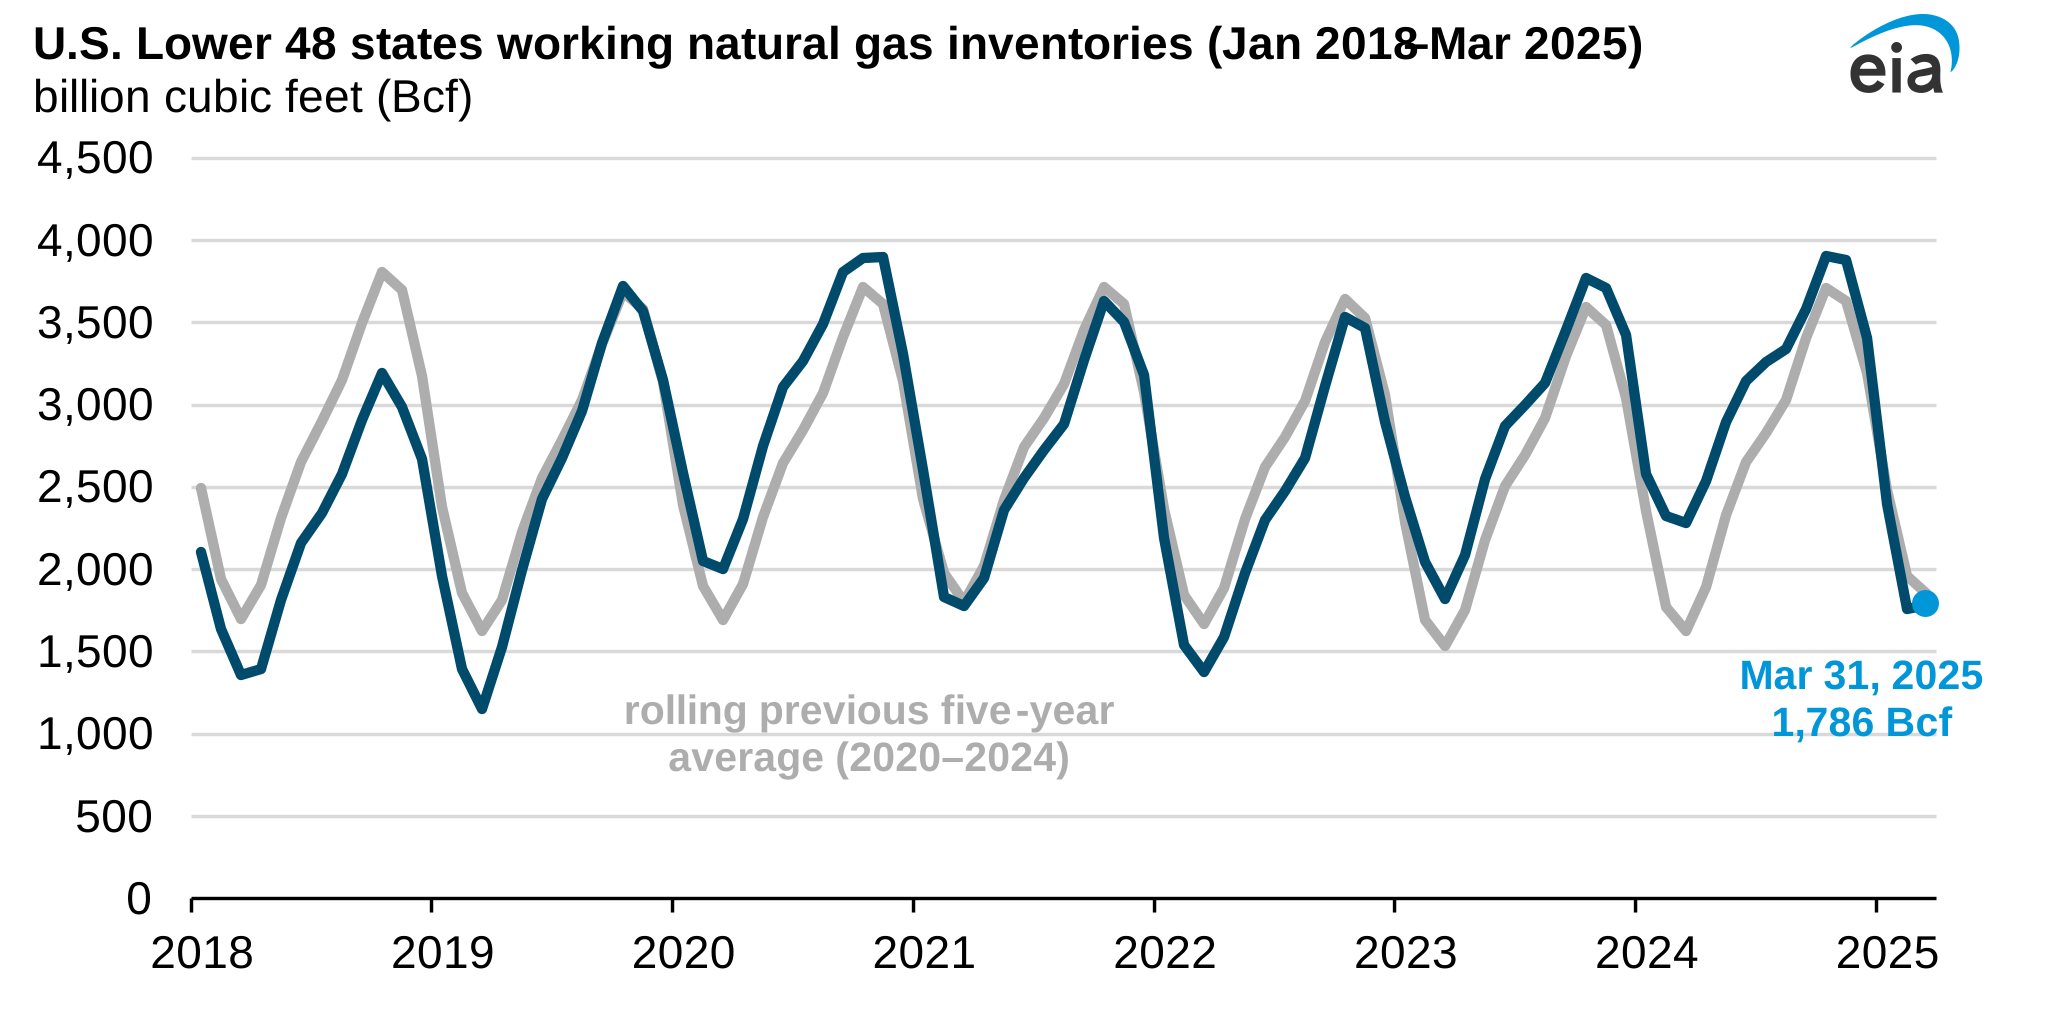
Note: We estimated end-of-month values for February and March from the Weekly Natural Gas Storage Report.
After a relatively warm start to the 2024–25 winter heating season (November–March), colder-than-normal temperatures across much of the United States in January and February resulted in increased consumption of natural gas and more withdrawals from U.S. natural gas storage than normal. By the end of March, the least amount of natural gas was held in U.S. underground storage in the Lower 48 states since 2022, with inventories 4% lower than the previous five-year average for that time of year, according to our Weekly Natural Gas Storage Report.
In January and February, the colder-than-normal temperatures across the country led to increased natural gas consumption in the residential, commercial, and electric power sectors. Consumption in the combined residential and commercial sectors in January and February averaged 97 billion cubic feet per day (Bcf/d), 16% more compared with the same period in 2024. A cold snap in the second half of January resulted in the fourth-largest reported weekly withdrawal from storage at 321 Bcf for the week ending January 24. Natural gas withdrawals in January and February combined totaled nearly 1,650 Bcf, or 33% more than the five-year (2020–24) average for those months.
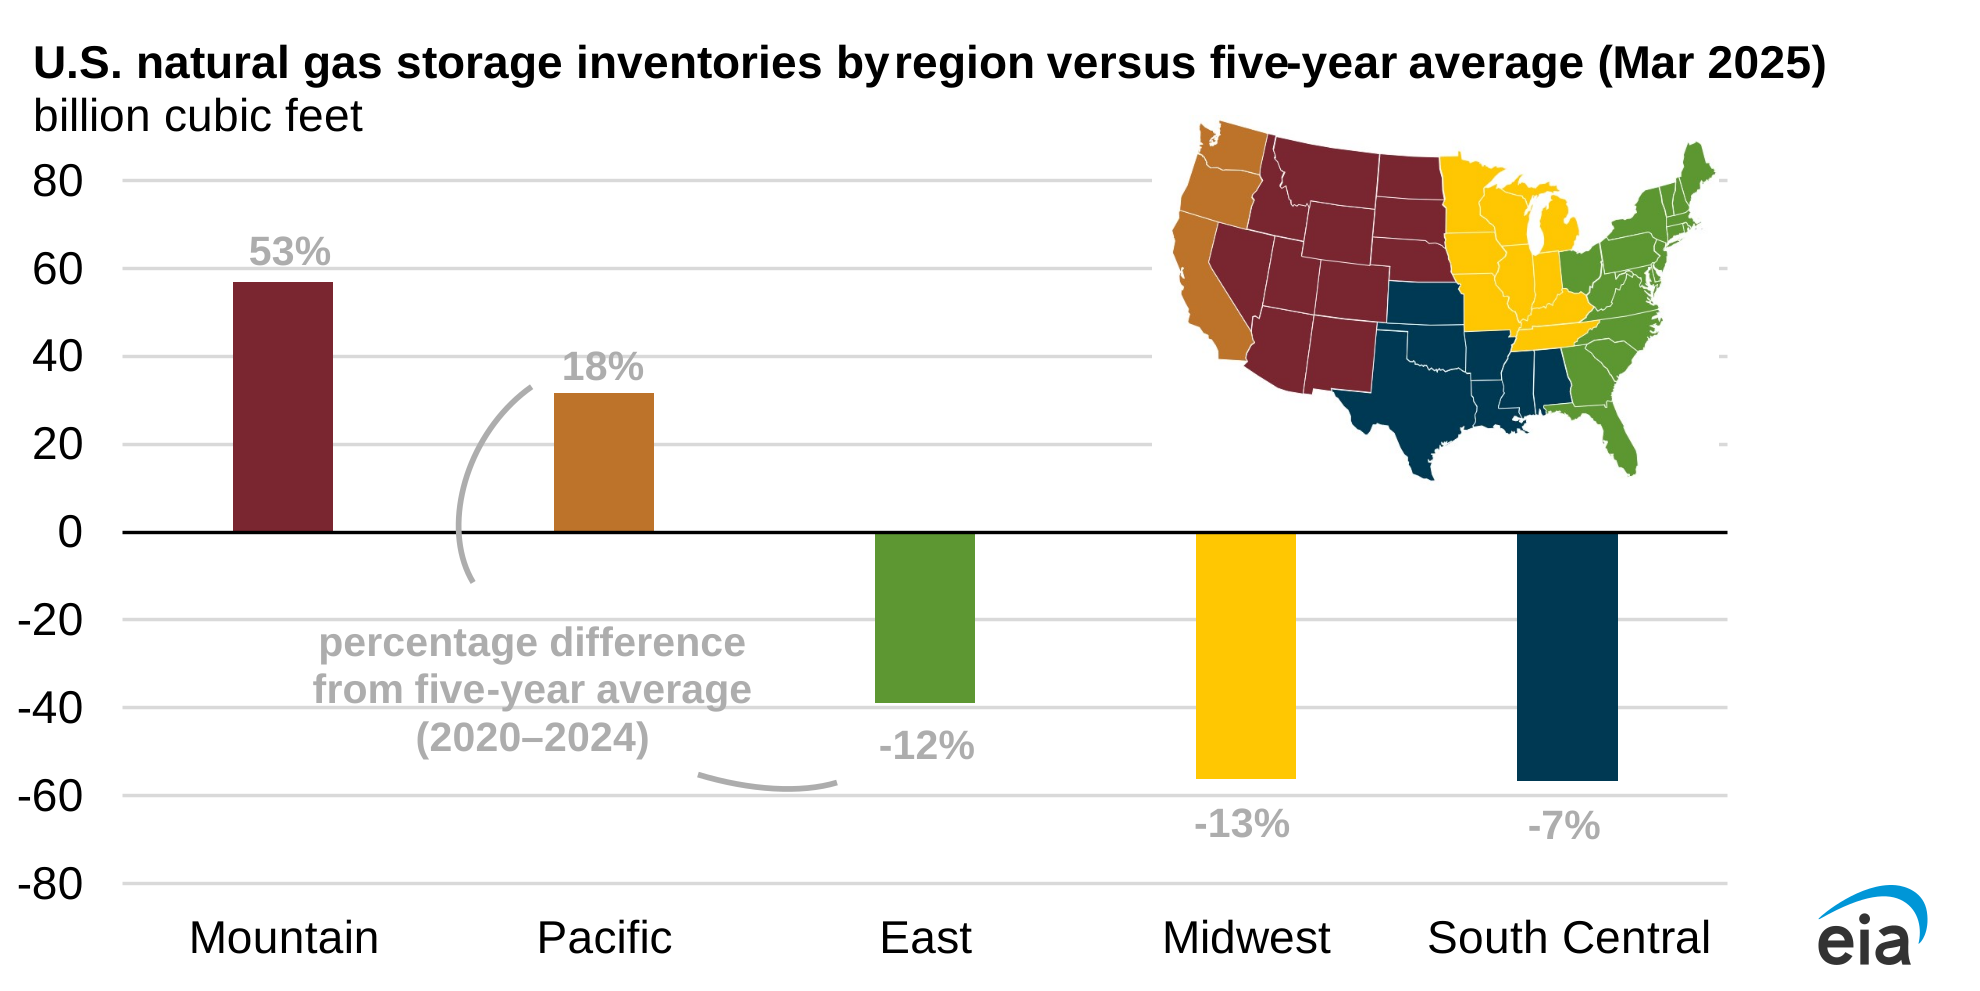
Working natural gas inventories in the Mountain and Pacific regions at the end of March exceeded the five-year average by 53% and 18%, respectively, while inventories elsewhere were less than the five-year average. At the start of the heating season in November, natural gas inventories in all regions in the Lower 48 states were above the five-year average. As the winter progressed, inventories in the East and Midwest regions fell below the five-year average by the end of December, and inventories in the South Central region were less than the five-year average by the end of January.
Warmer-than-normal temperatures in March resulted in net natural gas injections into storage for the month, signaling an earlier start to the injection season than is typical. Working natural gas in underground storage facilities in the Lower 48 states totaled 1,786 Bcf as of March 31, 2025.
Principal contributors: Katy Fleury, Jose Villar
Tags: natural gas, inventories/stocks, storage, weather