
U.S. crude oil production rose by 2% in 2024
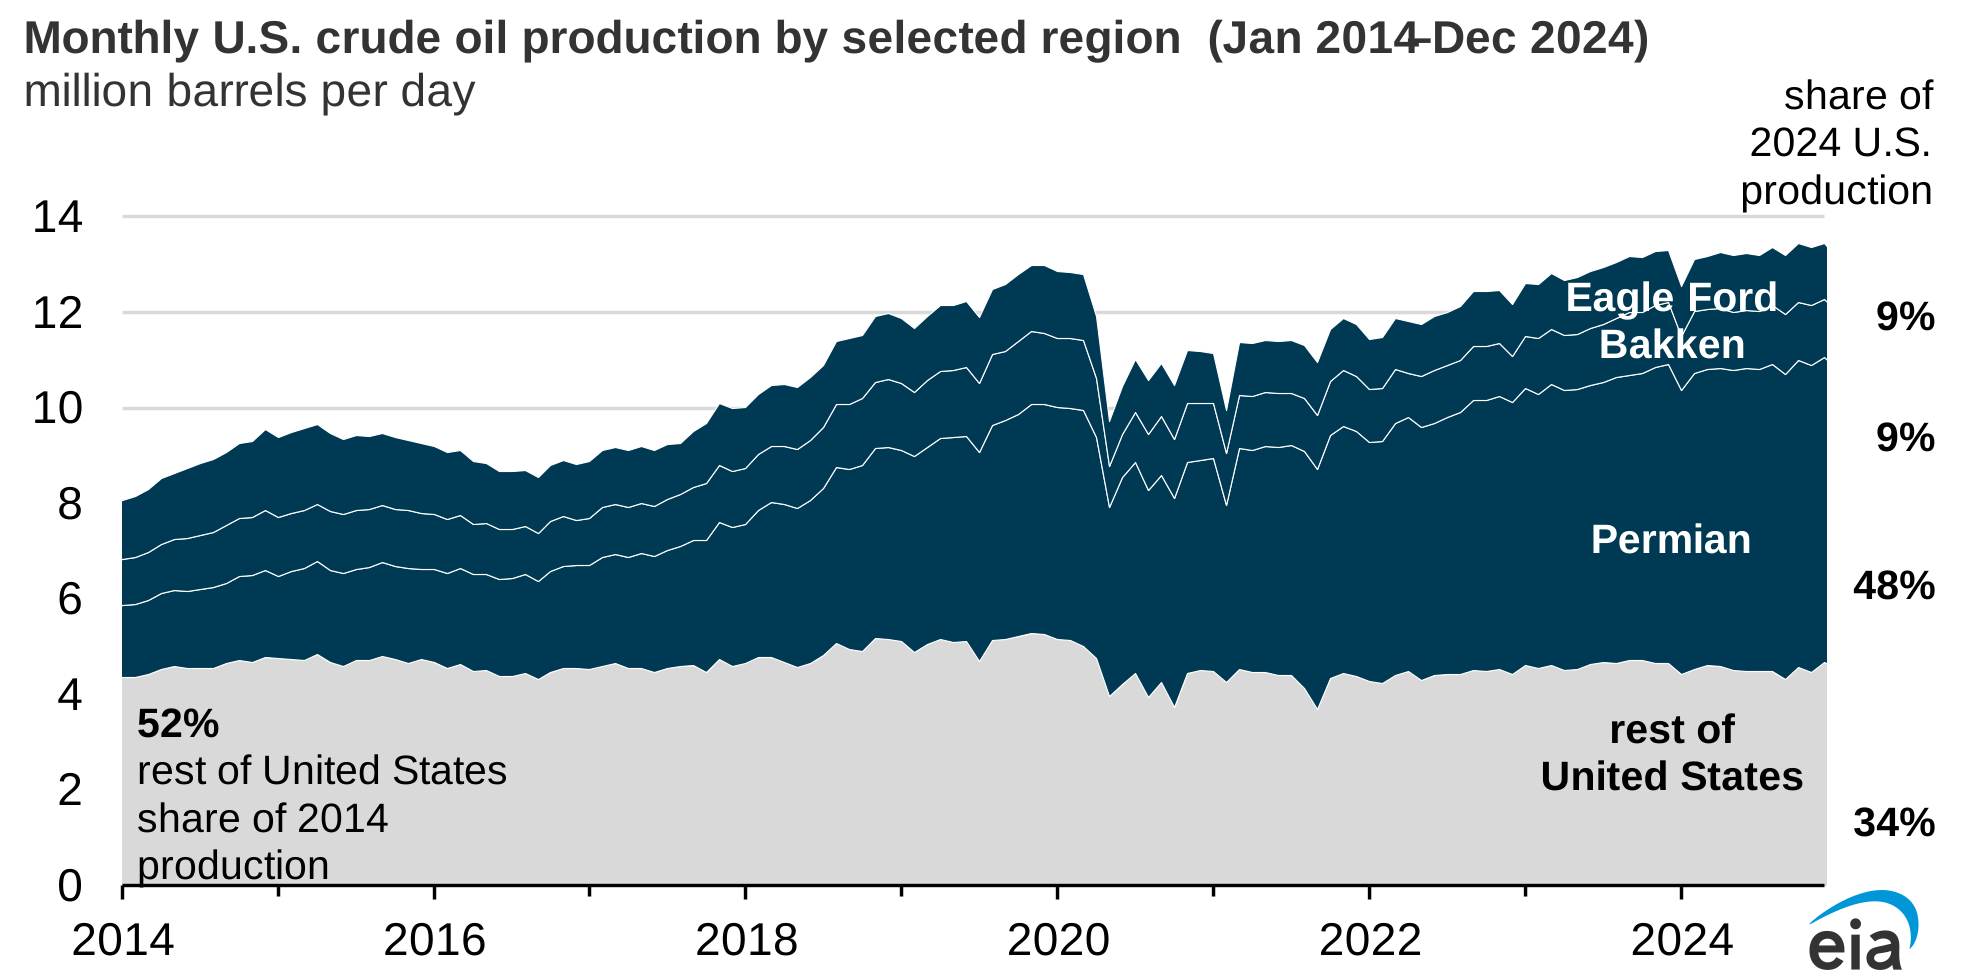
U.S. crude oil production grew by 270,000 barrels per day (b/d) in 2024 to average 13.2 million b/d, according to our Petroleum Supply Monthly. Almost all the production growth came from the Permian region.
Our Short-Term Energy Outlook (STEO) breaks out U.S. Lower 48 (L48) crude oil production data for the Appalachia, Bakken, Eagle Ford, Haynesville, and Permian regions, in addition to reporting Alaska and Gulf of America production data. For crude oil production, the Permian, Eagle Ford, and Bakken are the most prolific production regions, accounting for almost two-thirds of total U.S. production.
In 2024, the Permian region in western Texas and southeastern New Mexico produced more crude oil than any other region, accounting for 48% of total U.S. crude oil production. Permian region production also accounted for almost all the growth in 2024, rising by 370,000 b/d compared with 2023 to average 6.3 million b/d. West Texas Intermediate (WTI) crude oil prices averaged $77 per barrel (b) in 2024, high enough to support oil-directed drilling in the Permian region. The average breakeven price was $62/b in the Permian Midland Basin and $64/b in the Permian Delaware Basin, the two largest basins in the Permian, according to data from a Dallas Fed Energy survey.
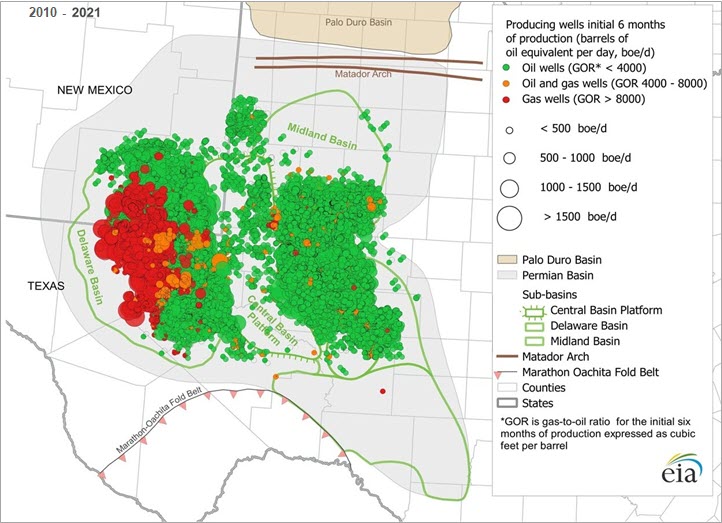
The Permian region averaged 308 active drilling rigs in 2024, accounting for more than half of the rigs in operation last year but 26 fewer rigs than in 2023. Even with the lower rig count in 2024, Permian production grew because well productivity improved. Producers used technological advancements such as artificial intelligence, electronic hydraulic fracturing technology, and automated drilling processes to optimize operations.
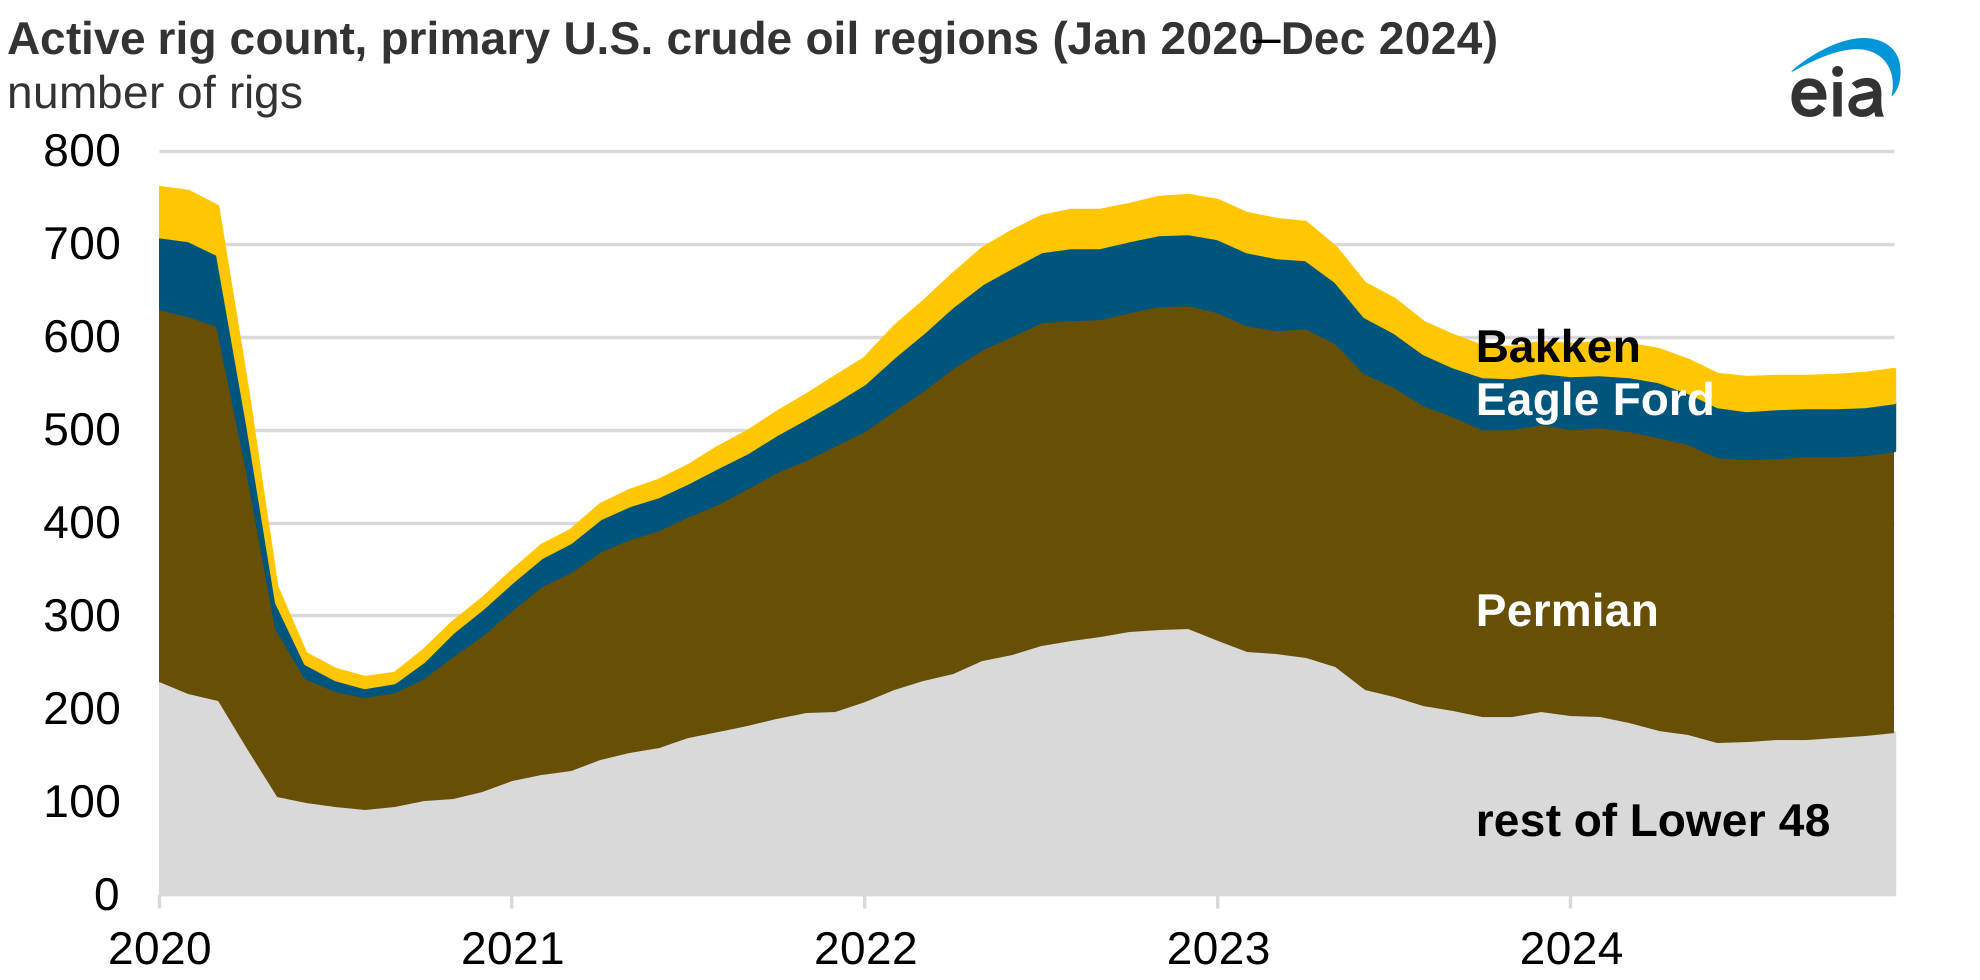
Although the Eagle Ford and Bakken regions each contributed 9% of the total U.S. crude oil production in 2024, production in these regions remained mostly flat. Both Eagle Ford and Bakken production showed similar growth, rising by 13,000 b/d to 1.2 million b/d. The rig count in the Eagle Ford fell by 9 rigs in 2024 to average 54 rigs, while the rig count in the Bakken fell by 2 rigs to average 34 rigs in 2024.
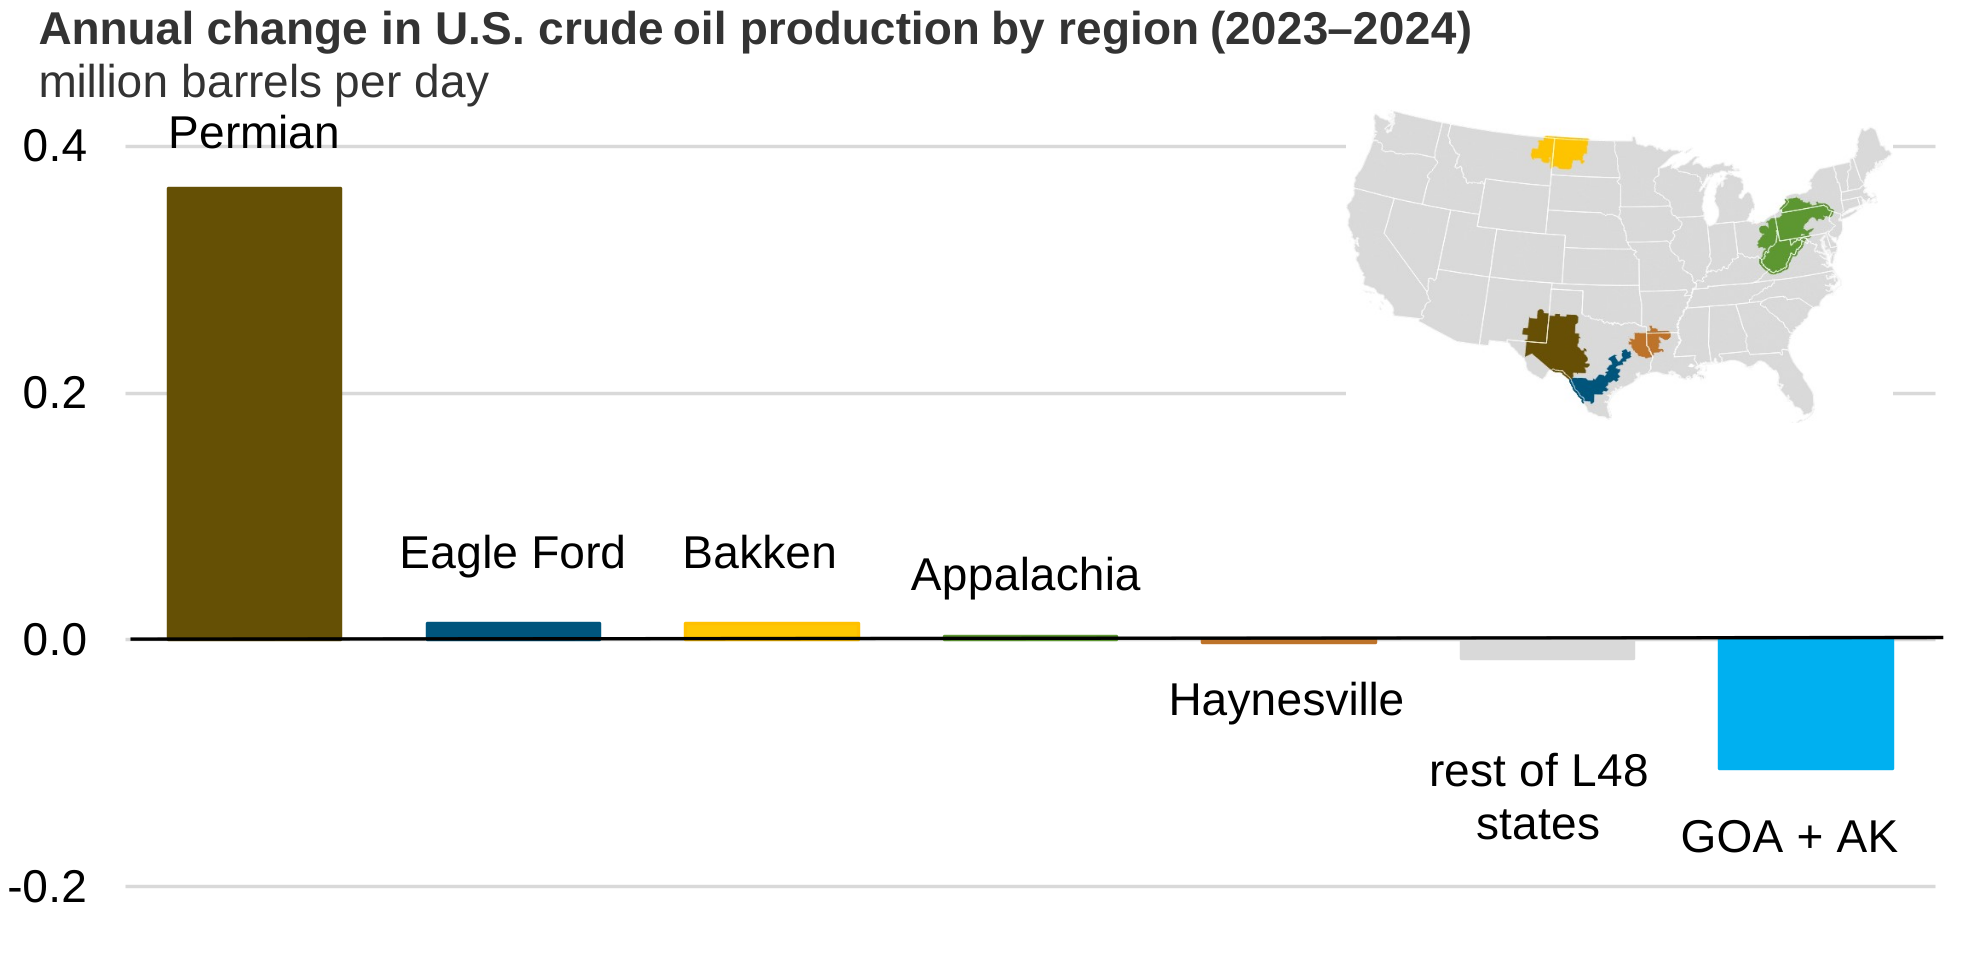
Note: GOA=Gulf of America; AK=Alaska; L48=Lower 48 U.S. states
Principal contributor: Naser Ameen