U.S. Energy Information Administration logo
Skip to sub-navigation
In-brief analysis
April 14, 2025

Eagle Ford natural gas production increases as crude oil production holds steady
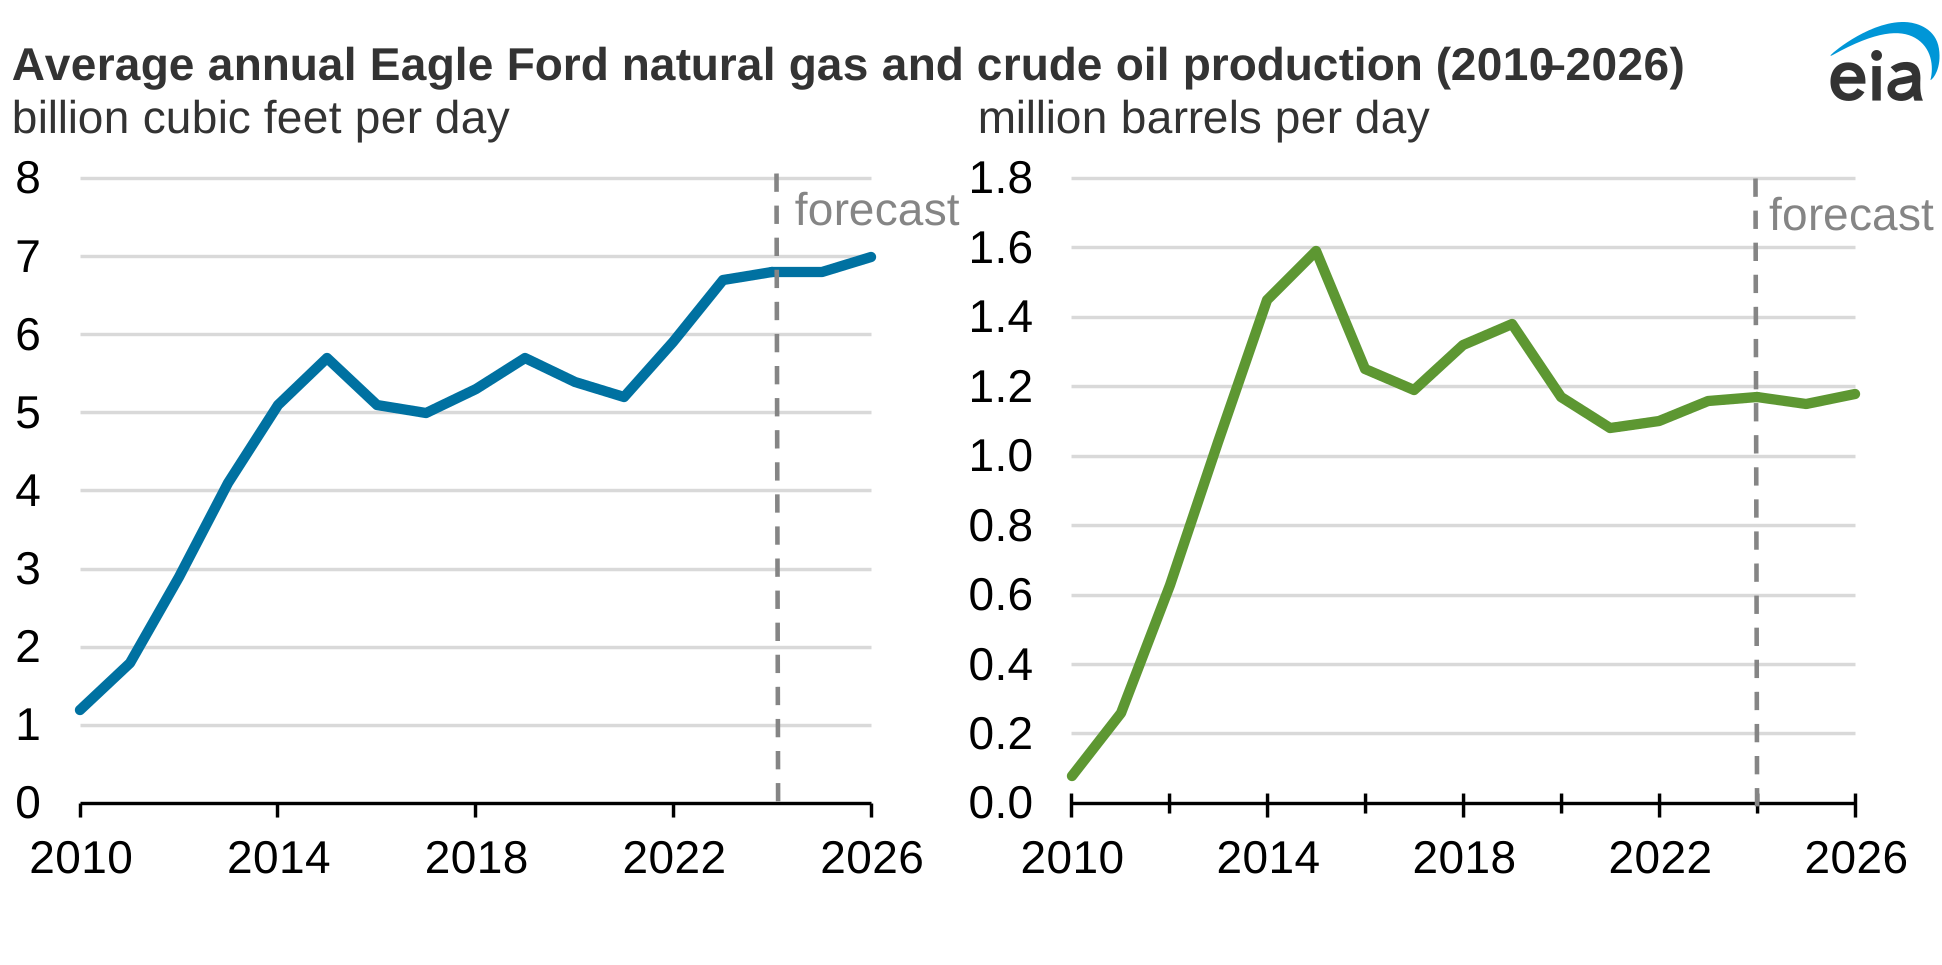
average annual Eagle Ford natural gas and crude oil production

Data source: U.S. Energy Information Administration, Short-Term Energy Outlook, April 2025

In our April Short-Term Energy Outlook, we forecast U.S. annual natural gas production from the Eagle Ford region in southwest Texas will grow from 6.8 billion cubic feet per day (Bcf/d) in 2024 to 7.0 Bcf/d in 2026. The increase in natural gas production comes as natural gas prices rise and demand for liquefied natural gas exports grows. Oil production in the Eagle Ford, on the other hand, has hovered around 1.1 million barrels per day (b/d) since 2020, and we forecast it will remain about the same through 2026.

This increase in natural gas production with stable oil production in the Eagle Ford region is a result of increasing gas-oil ratios. As more oil and natural gas are produced, pressure within the reservoir declines, allowing more natural gas relative to oil to be produced.

The Eagle Ford region contains many plays, the largest of which are the Eagle Ford play and the Austin Chalk play. Development in the Austin Chalk play in Texas began nearly a century ago, and the play has been undergoing a resurgence in drilling activity since 2014. Since 2014, oil production from the Austin Chalk play has nearly quadrupled, and natural gas production has increased by nearly 675%.
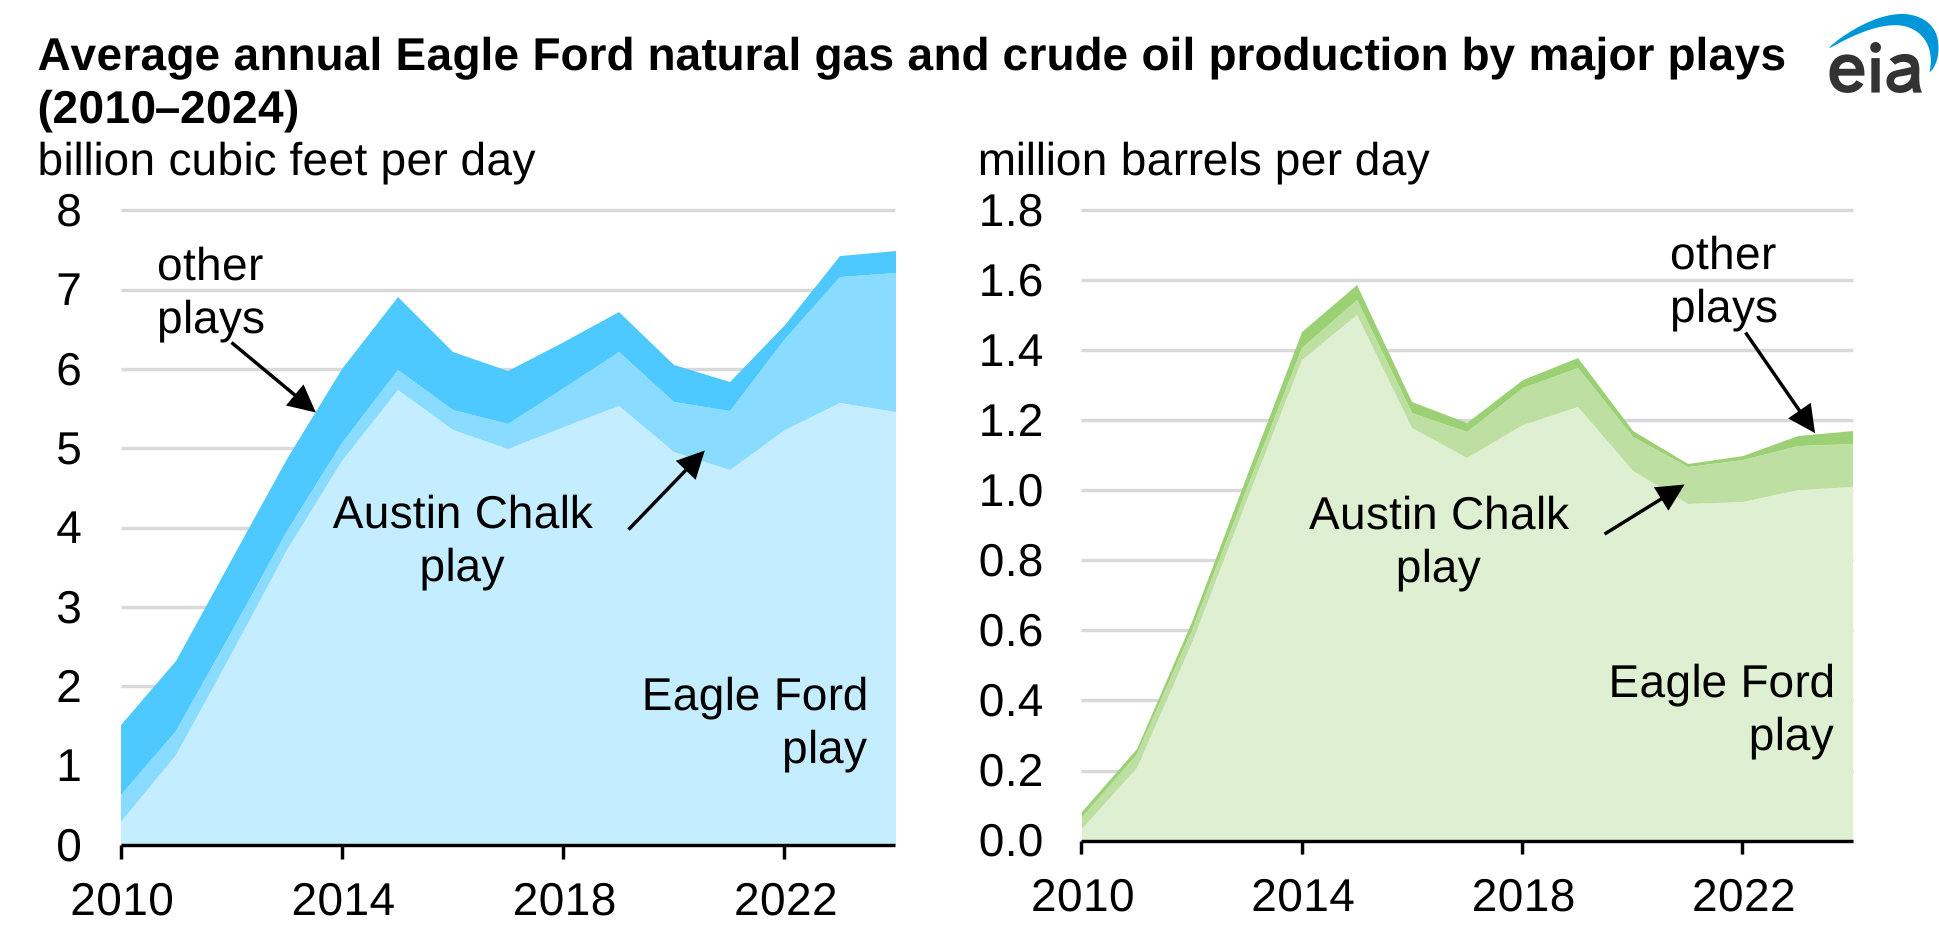
average annual Eagle Ford natural gas and crude oil production by major plays
Data source: U.S. Energy Information Administration, Short-Term Energy Outlook, April 2025; Enverus

The Eagle Ford play makes up 73% (5.5 Bcf/d) of the region’s natural gas production and 86% (1.0 million b/d) of the region’s oil production. Since 2020, natural gas production from the play has grown by 10% (0.5 Bcf/d) while oil production has declined by 4% (46,000 b/d).

The Austin Chalk play makes up 23% (1.8 Bcf/d) of the region’s natural gas production and 11% (125,000 b/d) of the region’s oil production. It is the fastest-growing play in the region, with natural gas production nearly tripling (1.1 Bcf/d) and oil production growing by 26% (26,000 b/d) since 2020.

Principal contributors: Trinity Manning-Pickett, Troy Cook

Statistics
Analysis
Tools
Education
News

Petroleum & Other Liquids

Crude oil, gasoline, heating oil, diesel, propane, and other liquids including biofuels and natural gas liquids.

Natural Gas

Exploration and reserves, storage, imports and exports, production, prices, sales.

Electricity

Sales, revenue and prices, power plants, fuel use, stocks, generation, trade, demand & emissions.

Coal

Reserves, production, prices, employment and productivity, distribution, stocks, imports and exports.

Nuclear & Uranium

Uranium fuel, nuclear reactors, generation, spent fuel.

Renewable & Alternative Fuels

Includes hydropower, solar, wind, geothermal, biomass and ethanol.

EIA Survey Forms

Forms EIA uses to collect energy data including descriptions, links to survey instructions, and additional information.

Total Energy

Comprehensive data summaries, comparisons, analysis, and projections integrated across all energy sources.

U.S. States

State energy information, including overviews, rankings, data, and analyses.

International

International energy information, including overviews, rankings, data, and analyses.

Environment

Greenhouse gas data, voluntary reporting, electric power plant emissions.

Data Tools, Apps, & Maps

Tools to customize searches, view specific data sets, study detailed documentation, and access time-series data.

Open Data

EIA's free and open data available as API, Excel add-in, bulk files, and widgets

EIA Beta

Come test out some of the products still in development and let us know what you think!

Open Source Code

EIA's open source code, available on GitHub.

RSS Feeds

Subscribe to feeds for updates on EIA products including Today in Energy and What's New.