
Natural gas spot prices fell across key regional trading hubs in 2024
Note: Prices are adjusted for inflation based on the December 2024 Consumer Price Index.
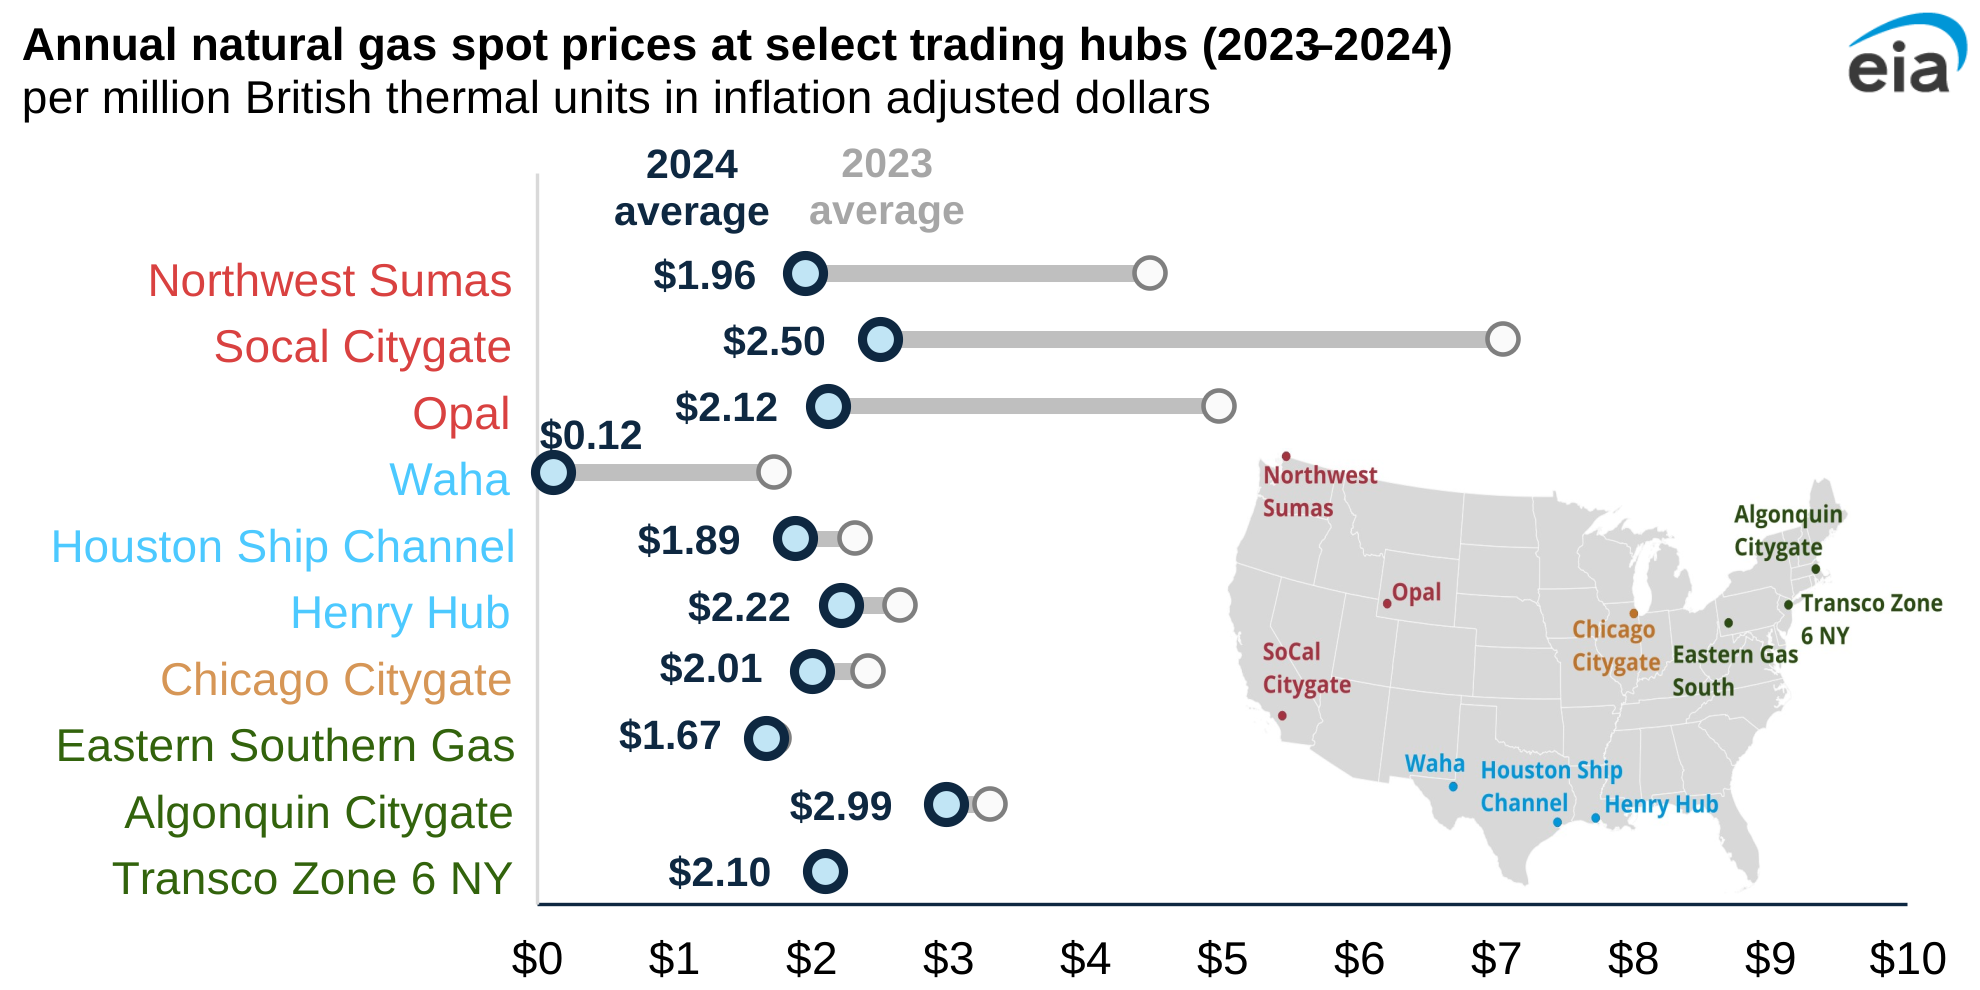
Average natural gas spot prices at most major trading hubs in the Lower 48 states declined in 2024 compared with 2023 in real terms, according to data from Natural Gas Intelligence.
Inflation-adjusted natural gas prices in the Northeast at Algonquin Citygate and Eastern Gas South averaged 32 cents per million British thermal units (MMBtu) and 6 cents/MMBtu lower in 2024, respectively, and western prices at Northwest Sumas and SoCal Citygate averaged $2.51/MMBtu and $4.55/MMBtu lower compared with 2023, respectively. In West Texas, prices at the Waha Hub near Permian Basin production activities traded below zero for 42% of trading days in 2024 as natural gas production from the Permian Basin outpaced available pipeline takeaway capacity. The Matterhorn Express Pipeline, capable of carrying 2.5 billion cubic feet per day from the Permian Basin to demand centers on the Texas coast, entered service in October 2024 and helped clear some of the regional production bottleneck. Since mid-November the price at the Waha Hub has been more than zero.
Prices at regional trading hubs decreased last year primarily because of relatively high natural gas inventories in each of the storage regions, sustained U.S. natural gas production, and mild winter temperatures. Because of relatively warm winter temperatures, particularly in the Northeast and Midwest (the largest consumers of natural gas for space heating), regional natural gas storage levels remained above the five year (2019–23) average for most of 2024.
Spot natural gas prices at the Henry Hub in Erath, Louisiana, which serves as the U.S. benchmark, averaged $2.22/MMBtu in 2024, the lowest average annual price in inflation-adjusted dollars ever reported.
Principal contributor: Andrew Iraola
Tags: natural gas, spot prices, map