
Canada’s Trans Mountain Pipeline expansion reportedly 95% complete
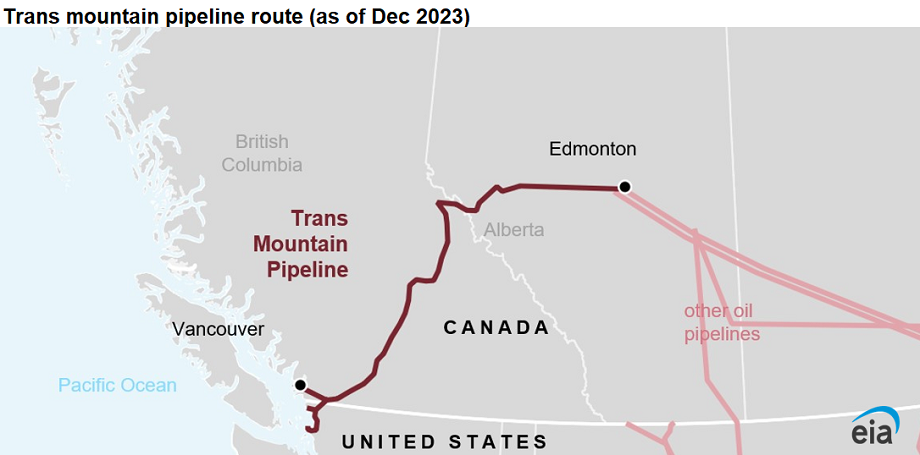
Work on Canada’s Trans Mountain Pipeline expansion project is reportedly over 95% complete. When it comes onstream, the expansion will nearly triple the pipeline’s current 300,000 barrels per day (b/d) capacity to move crude oil from oil sands in landlocked Alberta to Canada’s Pacific Coast for export to new customers in Asia or along the U.S. West Coast. Although initially expected to come online early this year, the project could be delayed as much as two years by a recent ruling, according to the project’s owner.
The existing Trans Mountain Pipeline currently offers one avenue for waterborne crude oil exports out of Canada by moving crude oil from Edmonton in Alberta to Burnaby, a port near Vancouver on the coast of British Columbia. The expansion project aims to increase the pipeline’s current capacity by 590,000 b/d, bringing the pipeline to a capacity of 890,000 b/d.
The Canadian government acquired the pipeline from Kinder Morgan for CA $4.5 billion in 2018 and formed the Trans Mountain Corporation (TMC) to oversee and manage the pipeline and the expansion project. The pipeline expansion, which consists of added pipeline capacity that generally runs along a similar route to the current pipeline, has faced several legal challenges from environmental activists and Canadian First Nations groups.
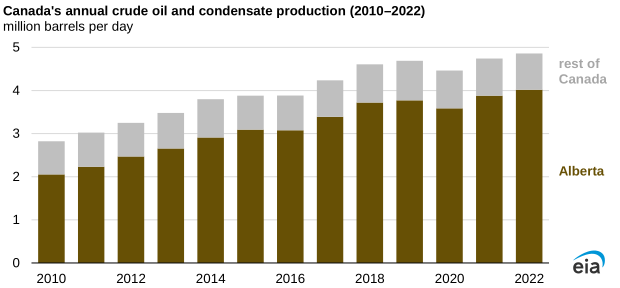
Canada’s crude oil production increased steadily for most of the last 13 years. Canada’s average annual production of crude oil and condensate rose nearly 2.0 million b/d between 2009 to 2019. In 2020, the effects of the COVID-19 pandemic decreased crude oil production as crude oil prices declined significantly. Canada’s production has since resumed its growth trend. Canada’s production exceeded pre-pandemic levels in 2022 when crude oil and condensate production averaged 4.9 million b/d, according to data from the Canada Energy Regulator (CER).
Most new growth in Canada’s crude oil production is concentrated in the landlocked province of Alberta. In 2022, Alberta’s crude oil production accounted for 82.7% of total crude oil production in Canada, up from 76.1% in 2012.
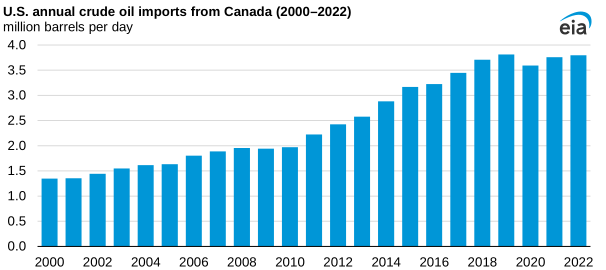
Currently, more crude oil flows from Canda to the United States than to any other country by a wide margin; U.S. imports from Canada have averaged about 3.7 million b/d since 2020, according to our Petroleum Supply Monthly. U.S. crude oil imports from Canada accounted for about 79% of Canada’s total crude oil production during that time. Canada is also the largest source of crude oil imports to the United States, and these imports primarily flow to refineries in the Midwest and the U.S. Gulf Coast.
CER’s refusal on December 5 to grant a variance request to Trans Mountain may delay the project start date. After the decision was issued, Trans Mountain indicated the delay could last as long as two years.
Principal contributor: Kevin Hack