
Higher wages in China increase consumer demand but have a limited effect on energy use
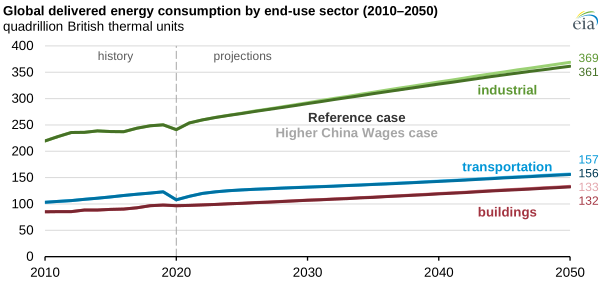
In the International Energy Outlook 2021 (IEO2021), Issues in Focus: Changes in Composition of Economic Growth in China, we compared the IEO2021 Reference case with the Higher China Wages case—a case in which we assumed that a smaller working-age population will result in a faster increase in wages through 2050. We compared these cases to better understand the potential economic outcomes in China and the associated energy use in each case.
Higher wages in China would result in greater disposable income, which would increase personal consumption expenditures. As a result, in the IEO2021 Higher China Wages case, higher wages result in personal consumption expenditures accounting for a greater share of China’s GDP than in the Reference case. Higher production costs for domestic products would mean that China would import more and export less as production costs in other countries become more competitive.
Internationally, these wage changes would also affect other countries through changes in global trade. Although changes in the Higher China Wages case are most noticeable in the industrial sector, the total global energy consumption increase that would occur across all sectors in 2050 would be relatively small—12.2 quadrillion British thermal units (quads) (1.4%) more than in the Reference case.
Regionally, the largest change in energy consumption across all sectors would occur in China (2.6 quads, or 1.3%, higher) and India (3.6 quads, or 3%, higher). These results show that, absent any additional policies, the shift from investment to consumption expenditures as a result of increased wages in China could have some effect on energy consumption. Somewhat unexpectedly, the largest changes in energy consumption in this case are outside of China because of the increased global demand for relatively lower cost products exported from India.
One approach to measuring an economy is by the expenditure components of GDP:
- Personal consumption expenditures
- Gross fixed private investment
- Government consumption expenditures
- Net exports (exports minus imports)
China's unique GDP structure is partly due to its historical development patterns. In 2020, investment as a percentage of China’s GDP was 43%, and the consumption expenditure share of GDP was a relatively small 38%.
By comparison, in more developed countries (for example, Organization for Economic Cooperation and Development (OECD) member countries), consumption expenditure as a percentage of GDP typically ranges from 50% to 70%, and the investment share of GDP ranges closer to 20% to 25%. As China’s economy and other emerging economies grow, they may follow the current pattern in developed economies for structural targets and goals. The Higher China Wages case results in consumption and investment expenditure shares much closer to current OECD levels by 2050 than in the IEO2021 Reference case.
Principal contributor: Elizabeth Sendich