U.S. Energy Information Administration logo
Skip to sub-navigation
July 19, 2021

United States continued to lead global petroleum and natural gas production in 2020
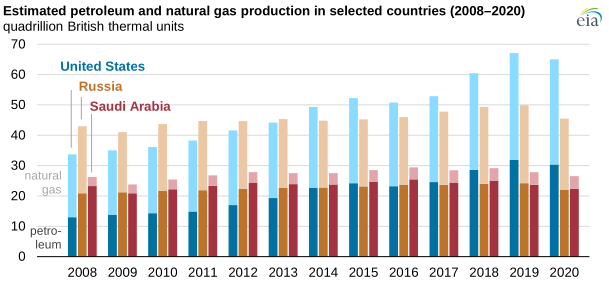
estimated petroleum and natural gas production in selected countries
Source: U.S. Energy Information Administration, International Energy Statistics
Note: Petroleum includes crude oil, condensate, and natural gas plant liquids.

More petroleum and natural gas was produced in the United States than in any other country during 2020 (a trend that began in 2014), despite year-on-year declines from the record-high production in 2019. U.S. petroleum and natural gas output in 2020 totaled 66.9 quadrillion British thermal units (quads), which was more than both Russia’s 45.5 quads and Saudi Arabia’s 26.5 quads of petroleum and natural gas production.

Petroleum and natural gas production fell in all three countries in 2020 following a rapid decline in demand during the COVID-19 pandemic and the consequent crude oil price declines, particularly in the first quarter of 2020. Saudi Arabia and Russia agreed to reduce their crude oil production as part of an OPEC+ agreement, but in the United States, reduced production was largely the result of a price-induced fall in tight oil investments and, to a lesser extent, unplanned outages.

Petroleum production includes several types of liquid fuels, including crude oil and lease condensate, natural gas plant liquids (NGPL), and bitumen. U.S. petroleum production decreased from 31.8 quads in 2019 to 30.4 quads in 2020. Crude oil and condensate accounted for the largest share of the decrease, at 1.9 quads. In contrast, NGPL production in 2020 grew by 0.4 quads, boosted by an increase in domestic ethane consumption and in ethane exports.

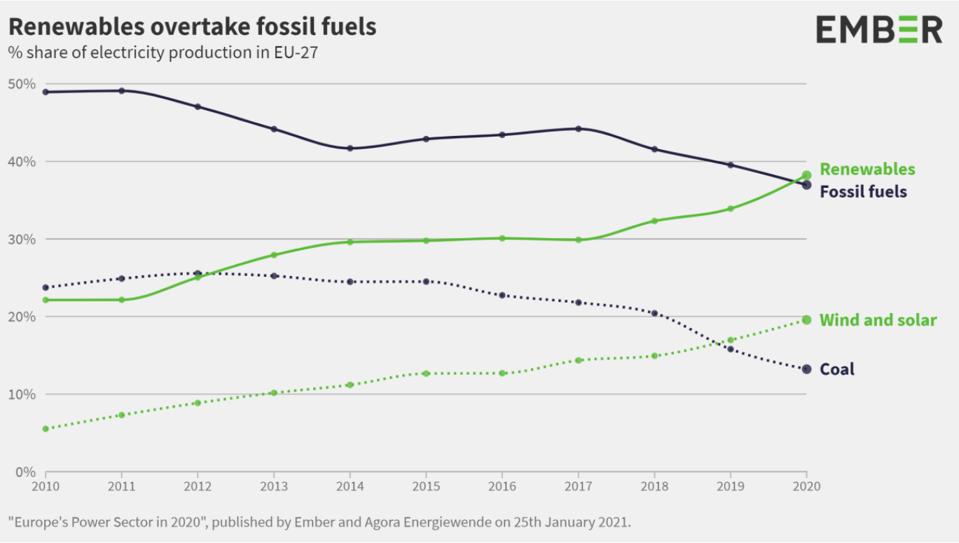
COVID-19-driven decreases in demand affected natural gas production far less. In Russia, natural gas production fell in response to milder-than-normal temperatures during the 2020–2021 winter and to increases in renewable electricity generation in the EU. Natural gas production in Russia fell by 2.1 quads, nearly equal to its decline of 2.3 quads in oil production.
Principal contributor: Bill Brown

Statistics
Analysis
Tools
Education
News

Petroleum & Other Liquids

Crude oil, gasoline, heating oil, diesel, propane, and other liquids including biofuels and natural gas liquids.

Natural Gas

Exploration and reserves, storage, imports and exports, production, prices, sales.

Electricity

Sales, revenue and prices, power plants, fuel use, stocks, generation, trade, demand & emissions.

Coal

Reserves, production, prices, employment and productivity, distribution, stocks, imports and exports.

Nuclear & Uranium

Uranium fuel, nuclear reactors, generation, spent fuel.

Renewable & Alternative Fuels

Includes hydropower, solar, wind, geothermal, biomass and ethanol.

EIA Survey Forms

Forms EIA uses to collect energy data including descriptions, links to survey instructions, and additional information.

Total Energy

Comprehensive data summaries, comparisons, analysis, and projections integrated across all energy sources.

U.S. States

State energy information, including overviews, rankings, data, and analyses.

International

International energy information, including overviews, rankings, data, and analyses.

Environment

Greenhouse gas data, voluntary reporting, electric power plant emissions.

Data Tools, Apps, & Maps

Tools to customize searches, view specific data sets, study detailed documentation, and access time-series data.

Open Data

EIA's free and open data available as API, Excel add-in, bulk files, and widgets

EIA Beta

Come test out some of the products still in development and let us know what you think!

Open Source Code

EIA's open source code, available on GitHub.

RSS Feeds

Subscribe to feeds for updates on EIA products including Today in Energy and What's New.