
Illinois is a top energy consumer and producer in the Midwest
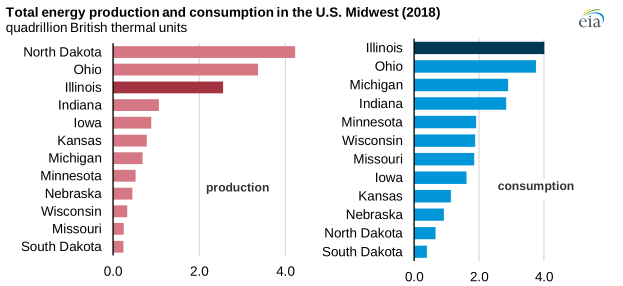
According to the U.S. Energy Information Administration’s (EIA) State Energy Data System (SEDS), Illinois had the highest energy consumption in the Midwest and was the third-highest energy producer of any state in the region. In 2018, customers in Illinois consumed 4.0 quadrillion British thermal units (Btu) of energy, and 2.6 quadrillion Btu was produced in the state. Total energy production and consumption in Illinois each accounted for nearly 17% of the Midwest’s total.
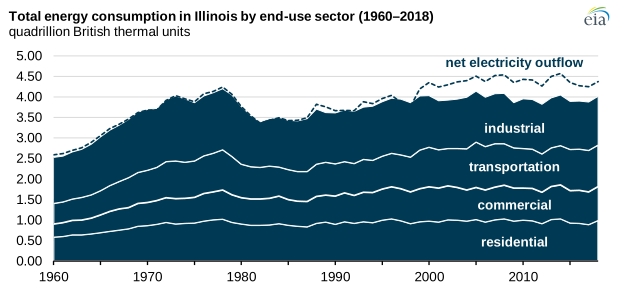
The industrial sector consumed more energy in Illinois in 2018 than any other sector, and it accounted for nearly 30% of the total energy consumed in the state in that year. The transportation and residential sectors each accounted for 25% of end-use energy consumed in Illinois, and the commercial sector represented a little more than 20% of Illinois’s consumption. Energy consumption in Illinois was slightly higher than the national average on a per capita basis and slightly lower than the national average on a per-unit state gross domestic product basis.
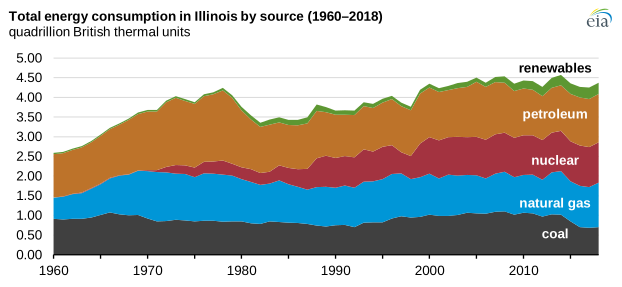
Petroleum was the most consumed fuel in Illinois, and it accounted for almost 28% of total energy use in 2018. Illinois is home to a sprawling network of highways and railways, as well as the nation’s second-busiest commercial airport, O’Hare International. Natural gas accounted for 26% of energy consumed in Illinois in 2018. Nearly 80% of Illinois residents use natural gas as their primary heating fuel, according to census data. Nuclear energy accounted for 23% of total energy consumed in the state. More electricity is generated by nuclear power plants in Illinois than in any other state. More electric power was generated in Illinois in 2018 than was consumed in 2018 because some of the electric power generated in Illinois was transmitted to other states.
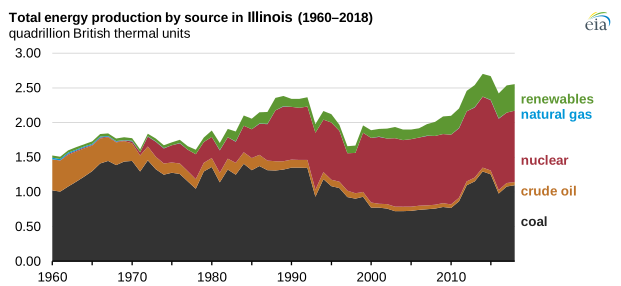
In 2018, almost 2.6 quadrillion Btu of energy was produced in Illinois. Coal accounted for nearly 43% of total energy production. Illinois contains about 15% of the nation’s economically recoverable coal reserves, second only to Wyoming, and it ranked fourth among the states in coal production in 2018. Illinois ranks second as a U.S. producer of bituminous coal, which is used to generate electricity and make steel.
In 2018, 15% of the energy produced in Illinois was from renewable sources. Illinois was the country’s third-largest ethanol producer and fourth-largest biodiesel producer in 2018. In 2019, wind-generated electricity in Illinois totaled 13.8 million megawatthours, more than in all but five states.
Illinois is home to several key components of energy infrastructure, especially near Chicago and Lake Michigan. Four petroleum refineries in Illinois have a combined refining capacity of 1 million barrels per day, the fourth highest of any state. Illinois also has 28 underground natural gas storage fields that provide more than 10% of the nation’s natural gas storage capacity, the second-largest share in the nation; only Michigan has more natural gas storage capacity.
Principal contributor: Brett Marohl
Tags: production/supply, consumption/demand, Midwest, Illinois, states