
Daily electricity demand in New York falls about 13% after COVID-19 mitigation efforts
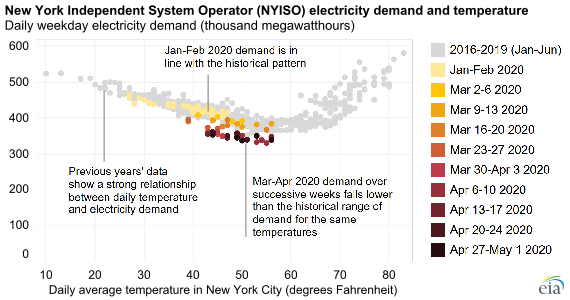
Recent business shutdowns and changes to normal routines related to mitigation efforts for the 2019 novel coronavirus disease (COVID-19) have caused daily, weekday electricity demand in New York state to decrease by 11%–14% in March and April compared with expected demand, after accounting for seasonal temperature changes. Electricity demand changes in New York state and in New York City, in particular, have been more pronounced than in other parts of the country, which may partly be caused by regional differences in how much electricity each end-use sector consumes and the varying effects of COVID-19 mitigation efforts on the sectors.
The U.S. Energy Information Administration’s (EIA) Hourly Electric Grid Monitor provides hourly electricity demand data from the 64 balancing authorities in the contiguous United States, including the New York Independent System Operator (NYISO), which operates the electric grid serving New York state. Using these data, EIA compared the daily electricity demand of each weekday in 2020 through May 1 to the average demand of all weekdays with the same daily average temperature from January through June in 2016–2019. Weekends and holidays were excluded.
Comparing current electricity demand to historical temperature-comparable days instead of simply to the same calendar day or week of previous years better isolates the effect of unexpected events, such as the mitigation efforts taken in response to COVID-19, because it accounts for any changes in electricity demand caused by normal seasonal temperature fluctuations. Electricity demand during the spring and fall shoulder seasons can be particularly volatile because temperatures often swing significantly from week to week.
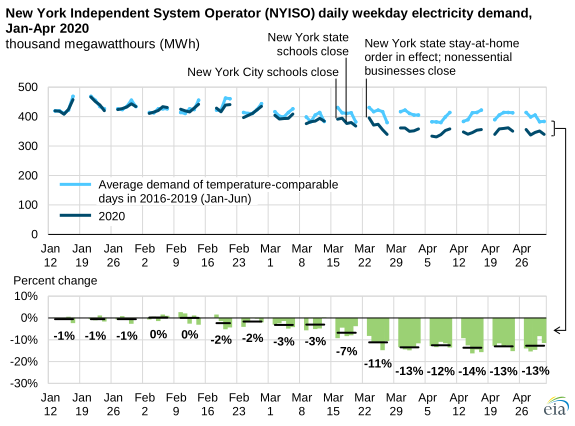
On the NYISO grid, daily weekday electricity demand in January 2020 and most of February 2020 closely tracked the average temperature-comparable historical demand before beginning to drop slightly at the end of February. This drop became more pronounced in March as the state began taking steps to limit the spread of COVID-19. By late March, weekday NYISO daily electricity demand averaged about 13% lower than temperature-comparable historical demand, where it remained through April.
NYISO reports that “the reduction in electric demand from commercial customers is a leading driver of overall reduced electricity consumption.” New York state’s electricity sales to commercial sector end users as a proportion of total electricity sales in the state is the second-largest in the nation (52%) after the District of Columbia (72%), based on preliminary 2019 data in EIA’s Electric Power Monthly (EPM).
EIA’s grid monitor data reflect total load served on the electric transmission grid and are not disaggregated by sector. Electricity consumption data by sector are available on a monthly basis in the EPM (Chapter 5) and the Form EIA-861M data files on a seven-week to eight-week lag.
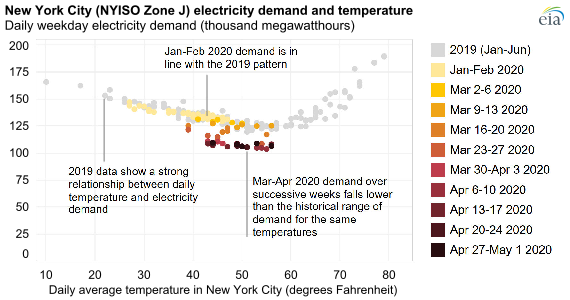
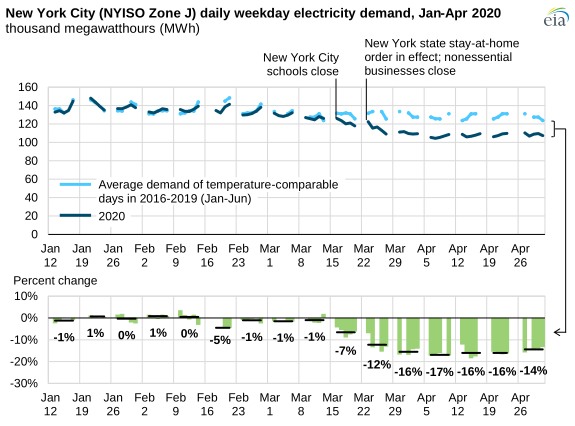
In New York City (NYISO Zone J), which normally accounts for about one-third of total NYISO electricity usage, electricity demand has dropped slightly more than it has in all of New York state. From late March through April, daily weekday electricity demand averaged about 16% lower than temperature-comparable historical demand, using 2019 data.
Source: U.S. Energy Information Administration, Hourly Electric Grid Monitor; National Oceanic and Atmospheric Administration, Aviation Weather Center and National Centers for Environmental Information
Source: U.S. Energy Information Administration, Hourly Electric Grid Monitor; National Oceanic and Atmospheric Administration, Aviation Weather Center and National Centers for Environmental Information
Tomorrow’s Today in Energy article will examine the impacts of the COVID-19 mitigation efforts on electricity demand in the central United States and Florida.
Principal contributors: April Lee, Jonathan DeVilbiss