
U.S. oil and natural gas proved reserves and production set new records in 2018
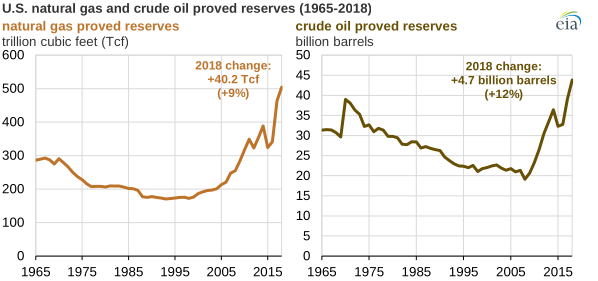
U.S. oil and natural gas proved reserves had another record-breaking year, according to the U.S. Energy Information Administration’s (EIA) U.S. Crude Oil and Natural Gas Proved Reserves, Year-End 2018 report, released in December 2019. U.S. proved reserves of crude oil and lease condensate rose to 47.1 billion barrels in 2018, a 12% increase compared with the previous record set at year-end 2017 of 42 billion barrels. U.S. proved reserves of natural gas rose to 504.5 trillion cubic feet (Tcf), a 9% increase compared with the record level set in 2017 of 464.4 Tcf. The growth in oil and natural gas proved reserves was driven by an increase in 2018 oil and natural gas prices.
Proved reserves are those volumes of oil and natural gas that geological and engineering data demonstrate with reasonable certainty to be recoverable in future years from known reservoirs under existing economic and operating conditions.
A favorable price environment in 2018 with relatively higher oil and natural gas prices drove the record U.S. oil and natural gas proved reserve levels. Higher fuel prices can often increase the proved reserves estimates because a larger portion of the oil or natural gas resource base can be economically producible. In 2018, the annual average spot price for West Texas Intermediate (WTI) crude oil rose from $51.03 per barrel (b) in 2017 to $65.66/b in 2018, a 29% increase. The annual average natural gas spot price at the Henry Hub national benchmark in Louisiana rose from $2.99 per million British thermal units (MMBtu) in 2017 to $3.35 per MMBtu in 2018, a 12% increase.
U.S. crude oil and lease condensate production increased 17% in 2018 compared with 2017. In 2018, U.S operators produced an average of 10.96 million barrels per day (b/d), 1.6 million b/d more than in 2017. U.S. marketed natural gas production increased 12% in 2018 compared with 2017. Operators produced 89.9 billion cubic feet (Bcf) of marketed natural gas per day in 2018, 10 Bcf/d more than in 2017.
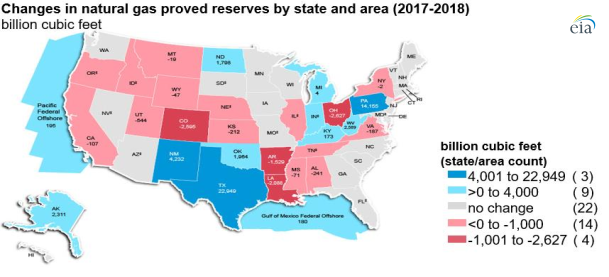
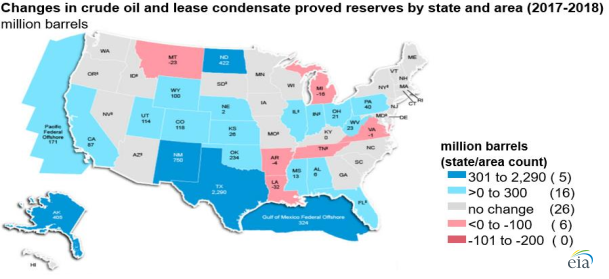
Texas saw the largest net increase in oil and natural gas proved reserves of all states in 2018, totaling 2.3 billion barrels of crude oil and lease condensate proved reserves and 22.9 Tcf of natural gas proved reserves. The largest share of the increase was produced in the Wolfcamp and Bone Spring shale plays in the Permian Basin.
The next-largest net gains in natural gas proved reserves in 2018 were in Pennsylvania and New Mexico. Pennsylvania’s natural gas proved reserves increased by 14.2 Tcf and New Mexico’s increased by 4.2 Tcf in 2018. Development in these states was led by the Marcellus shale play in the Appalachian Basin and the Wolfcamp and Bone Spring shale plays in eastern New Mexico.
New Mexico and North Dakota saw the second- and third-largest net gains in crude oil and lease condensate proved reserves in 2018. New Mexico’s crude oil and lease condensate proved reserves increased by 750 million barrels and North Dakota’s increased by 422 million barrels that year.
Principal contributor: Steve Grape