U.S. Energy Information Administration logo
Skip to sub-navigation
August 16, 2019

Annual U.S. refinery runs expected to decline for first time in 10 years
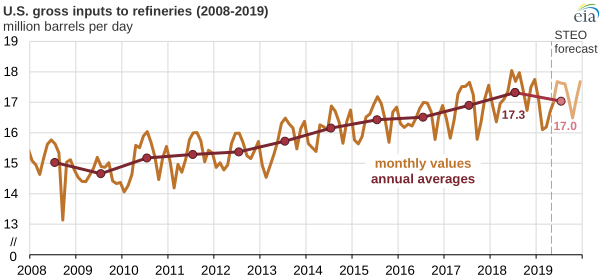
U.S. gross inputs to refineries
Source: U.S. Energy Information Administration, Petroleum Supply Monthly and Short-Term Energy Outlook

U.S. gross inputs to refineries, also known as refinery runs, have increased each year since 2009, most recently reaching a record high of 17.3 million barrels per day (b/d) in 2018. However, based on its monthly refinery run data through May and forecast for the remainder of 2019, the U.S. Energy Information Administration (EIA) expects refinery runs to decline and average 17.0 million b/d in 2019.

U.S. refinery capacity was at a record high of 18.8 million barrels per calendar day as of January 1, 2019. EIA’s annual Refinery Capacity Report shows that U.S. refining capacity will not expand significantly during 2019. EIA surveys refinery capacity annually, so any changes to refinery capacities during a calendar year will not be captured until the next survey at the beginning of the next calendar year.

In late June, damage from an explosion at the Philadelphia Energy Solutions (PES) refinery in South Philadelphia led PES to discontinue operations. The PES refinery had the largest refining capacity among East Coast refineries (335,000 b/d), but it experienced financial strains in recent years. In the six weeks since the explosion, refinery runs in the East Coast region (defined as Petroleum Administration for Defense District 1) have averaged 897,000 b/d, a decline of about 211,000 b/d from their averages in the six weeks before the explosion.
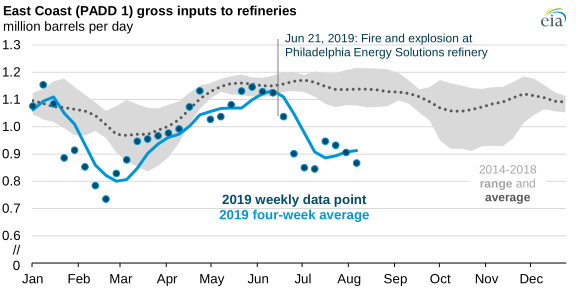
East Coast gross inputs to refineries
Source: U.S. Energy Information Administration, Weekly Petroleum Status Report

U.S. refinery runs typically reach their highest points in the summer, when demand for petroleum products (especially motor gasoline) tends to peak. So far in 2019, weekly refinery runs have averaged 17.0 b/d through August 9, or 1.4% lower than during the same period in 2018. Despite their overall lower rate, weekly refinery runs surpassed 18 million b/d in the week ending August 2—a level achieved only seven times in the past decade.
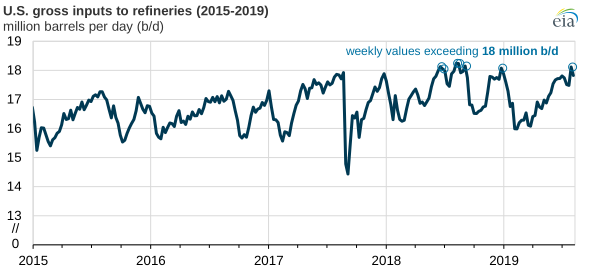
U.S. gross inputs to refineries
Source: U.S. Energy Information Administration, Weekly Petroleum Status Report

In its August Short-Term Energy Outlook, EIA expects refinery runs to average 17.0 million b/d in 2019, and EIA expects them to then increase to 17.6 million b/d in 2020 because of increases in both refining capacity and utilization.

Principal contributors: Owen Comstock

Statistics
Analysis
Tools
Education
News

Petroleum & Other Liquids

Crude oil, gasoline, heating oil, diesel, propane, and other liquids including biofuels and natural gas liquids.

Natural Gas

Exploration and reserves, storage, imports and exports, production, prices, sales.

Electricity

Sales, revenue and prices, power plants, fuel use, stocks, generation, trade, demand & emissions.

Coal

Reserves, production, prices, employment and productivity, distribution, stocks, imports and exports.

Nuclear & Uranium

Uranium fuel, nuclear reactors, generation, spent fuel.

Renewable & Alternative Fuels

Includes hydropower, solar, wind, geothermal, biomass and ethanol.

EIA Survey Forms

Forms EIA uses to collect energy data including descriptions, links to survey instructions, and additional information.

Total Energy

Comprehensive data summaries, comparisons, analysis, and projections integrated across all energy sources.

U.S. States

State energy information, including overviews, rankings, data, and analyses.

International

International energy information, including overviews, rankings, data, and analyses.

Environment

Greenhouse gas data, voluntary reporting, electric power plant emissions.

Data Tools, Apps, & Maps

Tools to customize searches, view specific data sets, study detailed documentation, and access time-series data.

Open Data

EIA's free and open data available as API, Excel add-in, bulk files, and widgets

EIA Beta

Come test out some of the products still in development and let us know what you think!

Open Source Code

EIA's open source code, available on GitHub.

RSS Feeds

Subscribe to feeds for updates on EIA products including Today in Energy and What's New.