
U.S. refineries running at near-record highs
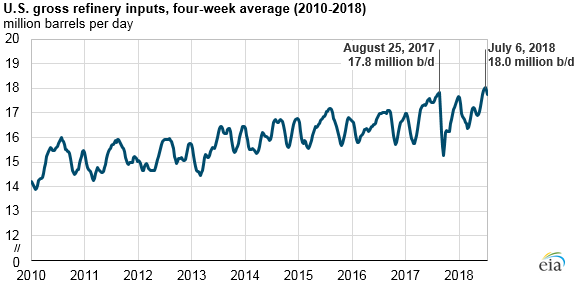
For the week ending July 6, 2018, the four-week average of U.S. gross refinery inputs surpassed 18 million barrels per day (b/d) for the first time on record. U.S. refineries are running at record levels in response to robust domestic and international demand for motor gasoline and distillate fuel oil.
Before the most recent increases in refinery runs, the last time the four-week average of U.S. gross refinery inputs approached 18 million b/d was the week of August 25, 2017. Hurricane Harvey made landfall the following week, resulting in widespread refinery closures and shutdowns along the U.S. Gulf Coast.
Despite record-high inputs, refinery utilization as a percentage of capacity has not surpassed the record set in 1998. Rather than higher utilization, refinery runs have increased with increased refinery capacity. U.S. refinery capacity increased by 862,000 barrels per calendar day (b/cd) between January 1, 2011, and January 1, 2018.
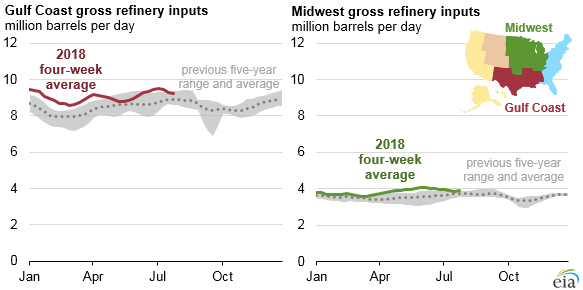
The record-high U.S. input levels are driven in large part by refinery operations in the Gulf Coast and Midwest regions, the Petroleum Administration for Defense Districts (PADDs) with the most refinery capacity in the country. The Gulf Coast (PADD 3) has more than half of all U.S. refinery capacity and reached a new record input level the same week as the record-high overall U.S. capacity, with four-week average gross refinery inputs of 9.5 million b/d for the week ending July 6. The Midwest (PADD 2) has the second-highest refinery capacity, and the four-week average gross refinery inputs reached a record-high 4.1 million b/d for the week ending June 1.
U.S. refineries are responding currently to high demand for petroleum products, specifically motor gasoline and distillate. The four-week average of finished motor gasoline product supplied—EIA’s proxy measure of U.S. consumption—typically hits the highest level of the year in August. Weekly data for this summer to date suggest that this year’s peak in finished motor gasoline product supplied is likely to match that of 2016 and 2017, the two highest years on record, at 9.8 million b/d. The four-week average of finished motor gasoline product supplied for the week ending August 3, 2018, was at 9.7 million b/d.
U.S. distillate consumption, again measured as product supplied, is also relatively high, averaging 4.0 million b/d for the past four weeks, 64,000 b/d lower than the five-year average level for this time of year. In addition to relatively strong domestic distillate consumption, U.S. exports of distillate have continued to increase, reaching a four-week average of 1.2 million b/d as of August 3, 2018. For the week ending August 3, 2018, the four-week average of U.S. distillate product supplied plus exports reached 5.2 million b/d.
In its August Short-Term Energy Outlook (STEO), EIA forecasts that U.S. refinery runs will average 16.9 million b/d and 17.0 million b/d in 2018 and 2019, respectively. If achieved, both would be new record highs, surpassing the 2017 annual average of 16.6 million b/d.
Principal contributors: Mason Hamilton, Kelsey Hallahan