
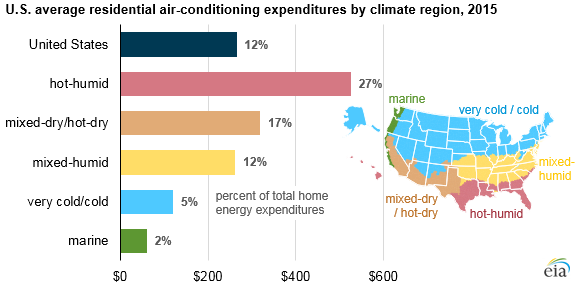
Air conditioning accounts for about 12% of U.S. home energy expenditures
Note: Climate regions based on Department of Energy Building America climate regions.
Air-conditioning equipment is used in 87% of homes in the United States and, according to the latest EIA Residential Energy Consumption Survey (RECS), home air-conditioning costs averaged $265 in 2015, or 12% of total home energy expenditures. Air-conditioning costs ranged from an average of $525 in the hot-humid region in the Southeast to about $60 in the temperate marine region along the West Coast. The more moderate mixed-humid region, where home air-conditioning costs averaged $262, was closest to the national average.
The average U.S. household spent $1,856 on home energy bills in 2015. Although air conditioning accounted for 12% of total household energy costs (and 17% of electricity expenditures) at the national level, some regions use much more air conditioning. In the hot-humid region, where air conditioning was used by 94% of households, air conditioning made up 27% of home energy expenditures. By comparison, in the marine region, where nearly half of households did not use air conditioning at all, air conditioning made up just 2% of home energy expenditures.
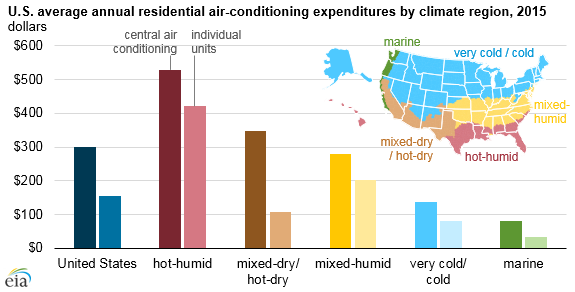
About 60% of U.S. households only used central air-conditioning systems in 2015, while 23% only used individual air-conditioning units and just slightly less than 5% of households used both equipment types. Central systems are very common in new single-family homes, but many older homes have also been retrofitted in recent years. For example, the 1980 and 1993 RECS found that about 50% of homes built in the 1970s had central air-conditioning equipment, but by 2015 that share had increased to 67%.
Households with individual units typically only air condition a few rooms or spaces within a home. On average, a home that uses individual air-conditioning units has two window, wall, or portable units. Individual units are relatively more common in smaller housing units such as apartments and mobile homes.
Note: Climate regions based on Department of Energy Building America climate regions.
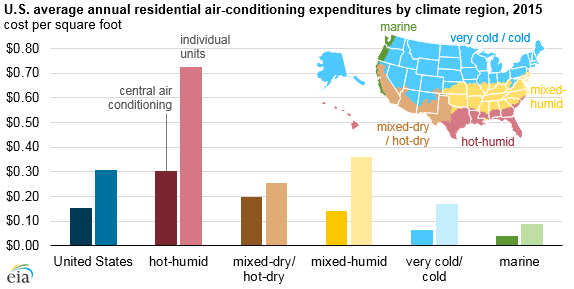
Households that used central systems spent about twice as much for air conditioning in 2015 as households with individual units, with average costs of $299 compared with $156. However, because the homes using central systems were often larger, the cost per square foot of using an individual air-conditioning unit was about twice as much as using a central system, at $0.31 per square foot compared with $0.15 per square foot.
Note: Climate regions based on Department of Energy Building America climate regions.
The 2015 RECS data includes estimates for a larger number of end uses than in previous RECS surveys, allowing for a broader understanding of household energy use. Some households stay comfortable in the summer by using evaporative coolers, dehumidifiers, or ceiling fans instead of or in addition to air-conditioning equipment, and in 2015, households using these devices spent $161, $128, and $36 on average to operate them, respectively. In addition, households using central air conditioning spent an estimated $16 annually to circulate their cooled air through air handlers.
Detailed information about household energy usage and costs can be found in the RECS Consumption & Expenditures data tables.
Principal contributor: Danni Mayclin