
EIA updates layers to U.S. Energy Mapping System
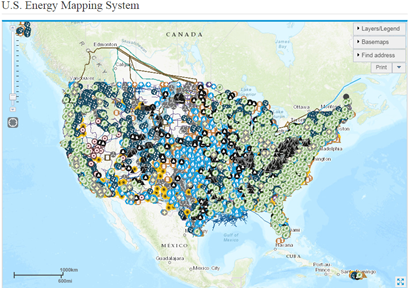
EIA’s U.S. Energy Mapping System is an interactive, comprehensive visual reference for energy infrastructure in the United States. Several layers in the system were recently updated, allowing users to see locations of several types of energy infrastructure, including wind turbines, coal mines, oil and natural gas wells, high-voltage electric transmission lines, natural gas pipelines, and U.S. border-crossing points of electric transmission lines and liquids and natural gas pipelines.
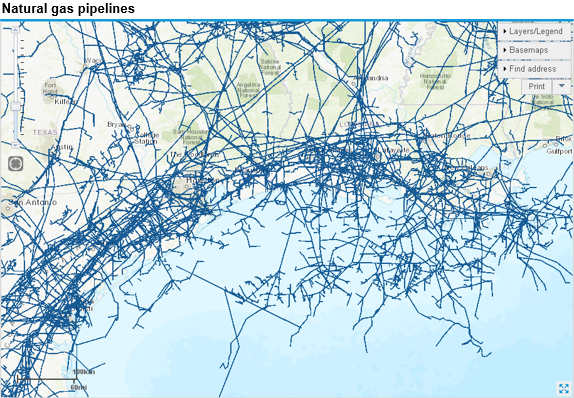
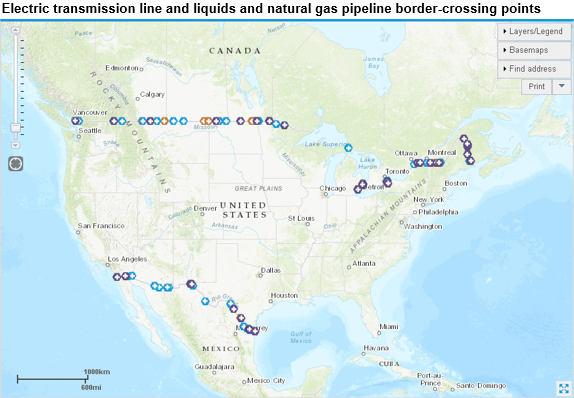
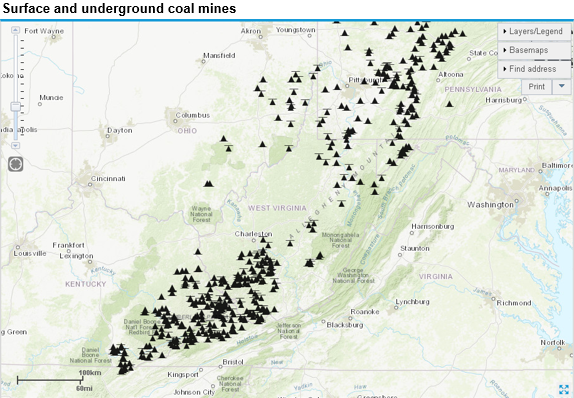
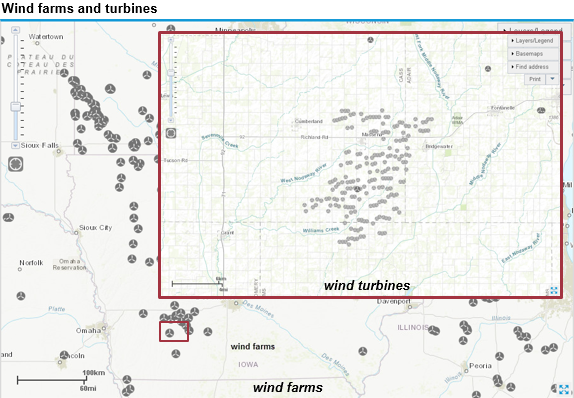
Recently updated map layers include the following:
- Power plants with capacity of one megawatt or more
- Crude oil, natural gas, petroleum product, and hydrocarbon gas liquids pipelines
- Oil and natural gas wells
- Border crossings for electric transmission lines, liquids pipelines, and natural gas pipelines
- Natural gas underground storage facilities
- Coal mines, both underground and surface
- Oil and natural gas platforms in federal waters
- Sedimentary basins with tight oil or shale gas plays
- Petroleum product terminals
- High-voltage electricity transmission lines
- Electric retail service territories
Most of these layers are sourced from EIA surveys or other U.S. government sources such as the Federal Energy Regulatory Commission, U.S. Geological Survey, U.S. Bureau of Ocean Energy Management, and the Homeland Infrastructure Foundation. EIA creates some layers by compiling information from publicly available data sources. Because these sources may contain information at different scales with varying levels of accuracy, some layers, such as pipelines at border crossings, are not visible when zoomed in at closer scales.
Layers created by EIA or based on EIA surveys are also provided as shapefiles that users can combine as layers with information from other sources and can use to conduct their own geospatial analysis. In some cases, shapefiles may not be available because of copyright restrictions from the data source.
Updates to these layers also include more recent information for many of the interactive energy infrastructure maps EIA provides:
- Energy disruptions map, which combines energy infrastructure information with real-time storm layers from the National Oceanic and Atmospheric Administration (NOAA)
- Flood vulnerability assessment map, which shows infrastructure vulnerable to rising sea levels, storm surges, and flash floods, based on information from the Federal Emergency Management Agency (FEMA)
- Gulf of Mexico fact sheet, with information about the country’s petroleum refining capacity and natural gas plant processing capacity
- Major oil and gas plays, with boundaries, contours, and thicknesses of many of the major low-permeability oil and natural gas plays in the Lower 48 states
EIA’s State Energy Profiles show these map layers and highlight energy facts for each of the 50 states, the District of Columbia, and U.S. Territories based on information in EIA’s State Energy Data System.
Users of the U.S. Energy Mapping System can sign up for email alerts to receive notifications of mapping system updates.
Principal contributors: Owen Comstock, Michael Mobilia
Tags: map