
Coal production and prices decline in 2015
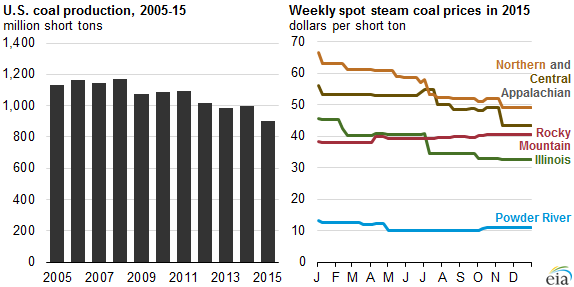
Note: Production data for 2015 include estimated December 2015 production.
Since reaching a high point in 2008, coal production in the United States has continued to decline. U.S. coal production in 2015 is expected to be about 900 million short tons (MMst), 10% lower than in 2014 and the lowest level since 1986. Regionally, production from the Appalachian Basin has fallen the most. Low natural gas prices, lower international coal demand, and environmental regulations have contributed to declining U.S. coal production.
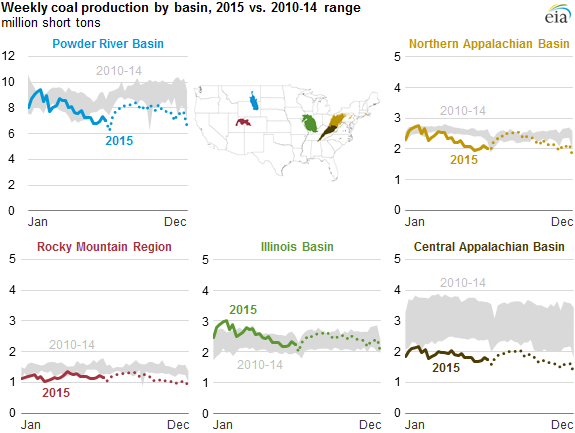
Note: Data for July 2015 through December 2015 are EIA estimates.
The United States has five major basins or regions that produce coal. The largest decline in coal production was in the Central Appalachian Basin, largely because of its difficult mining geology and high operating costs. Coal production in the Central Appalachian Basin in 2015 was 40% below its annual average level over 2010-14. In three other main areas, the Northern Appalachian Basin, Rocky Mountain region, and Powder River Basin, production in 2015 was 10% to 20% below their corresponding regional annual average levels over 2010-14. By contrast, coal production from the Illinois Basin in 2015 was 8% higher than production levels over 2010-14.
In the United States, almost all coal is used to generate electricity. Recently, coal's share of electricity generation has fallen as its market share of natural gas and renewables increased. The average daily natural gas spot price at the Henry Hub, a key natural gas benchmark, fell from $4.38 per million British thermal units (MMBtu) in 2014 to $2.61/MMBtu in 2015, resulting in greater natural gas-fired electricity generation. In April 2015, natural gas-fired electricity generation surpassed that of coal-fired generation on a monthly basis for the first time in history, and it did so again in each of the months from July through at least October, the latest monthly data available. The most recent Short-Term Energy Outlook estimates that 2015 power sector coal consumption will be about 764 MMst, the lowest level since 1988.
U.S. coal exports also declined in 2015, especially to major coal export destinations such as Europe and China. Although 15.7 MMst of coal was exported to the United Kingdom and Italy in 2014, only about half that volume is expected in 2015, when complete data are available. China, the world's largest coal consumer, is traditionally a large market for international coal trade, and China imported 8.3 MMst from the United States in 2013, about 7% of total U.S. coal exports that year. In 2014, U.S. coal exports to China decreased to 1.8 MMst, and the 2015 total is expected to be less than 0.5 MMst. Based on U.S. Census Bureau data through September 2015 and estimates for the remainder of the year, EIA expects the United States to export a total of 77 MMst of coal in 2015, a 21% decline from the previous year.
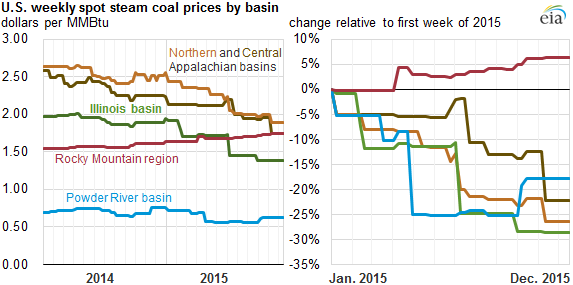
With the exception of the Rocky Mountain region, steam coal prices in major basins experienced double-digit percentage declines in 2015. Central Appalachian coal continued to be economically challenged compared with natural gas for electricity generation, and average steam coal spot prices dropped by another 22% in 2015, following a decline of 13% the year before. Coal prices in the Powder River, Illinois, and North Appalachian basins, which had remained largely unchanged during 2014, decreased 18%, 26%, and 29%, respectively, in 2015.
Principal contributor: Brian Park
Tags: coal, electricity, generation, prices, production/supply