
Crude oil prices started 2015 relatively low, ended the year lower
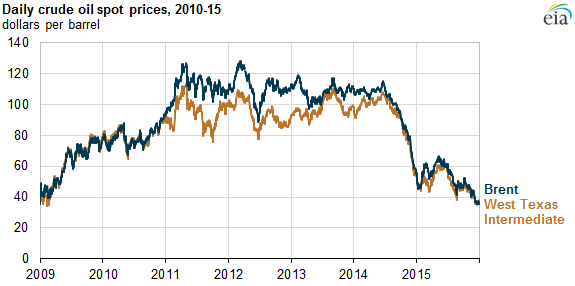
Crude oil prices ended 2015 below $40 per barrel (b), the lowest level since early 2009. Spot prices for the international crude oil benchmark Brent averaged $52/b in 2015, 53% below the level in 2014 and 49% below the average price over 2010-14. Spot prices for West Texas Intermediate (WTI) crude oil were also down 53% in 2015 compared with 2014, averaging $49/b for the year.
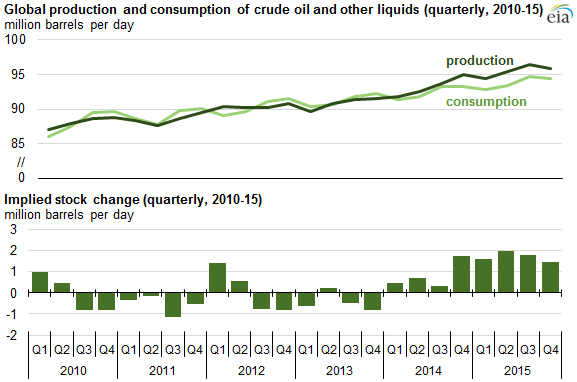
Lower crude oil prices in 2015 reflected the sustained excess of crude oil supply over global demand. As a result, global crude oil and other liquids inventories increased steadily through the year. Global inventories increased in each quarter of 2015, with a net inventory build of 1.72 million barrels per day, the highest rate since at least 1996.
U.S. highlights for 2015
- As a result of lower crude oil prices, U.S. crude oil production began to decline in the second quarter of 2015. The decrease was led by reductions in Lower 48 onshore production, which began to fall in April. Despite the decline, production of crude oil averaged an estimated 9.3 million barrels per day (b/d) in 2015, a 7% increase over 2014 and the highest rate since 1972.
- The Brent-WTI price spread averaged less than $4/b in 2015, $3/b narrower than in 2014, and significantly below the 2011-13 average, when Brent traded nearly $14/b higher than WTI.
- Based on data through October, U.S. imports of crude oil fell to their lowest level since 1995. Canada, Saudi Arabia, Venezuela, and Mexico continue to be the main sources of imported crude oil.
- Restrictions on U.S. exports of crude oil were removed at the end of the year. However, EIA analysis indicates that the policy change is unlikely to result in a significant increase in crude exports from the United States given current market conditions
International highlights for 2015
- EIA estimates that total Organization of the Petroleum Exporting Countries (OPEC) crude oil and other liquids production increased 3% to 37.4 million b/d in 2015, led by production growth in Iraq.
- At its December 4 meeting, OPEC members announced they "should continue to closely monitor developments in the coming months," indicating that OPEC producers, led by Saudi Arabia, are continuing the policy of supporting production and defending market share in a low oil price environment.
- On July 14, the Joint Comprehensive Plan of Action (JCPOA) between Iran and the five permanent members of the United Nations Security Council and Germany (P5+1) was announced. The agreement could lead to sanctions relief, contingent on verification by the International Atomic Energy Agency (IAEA) that Iran has complied with key nuclear-related steps.
Principal contributor: Hannah Breul