
Proposed Clean Power Plan rule would reduce coal production, especially in the West
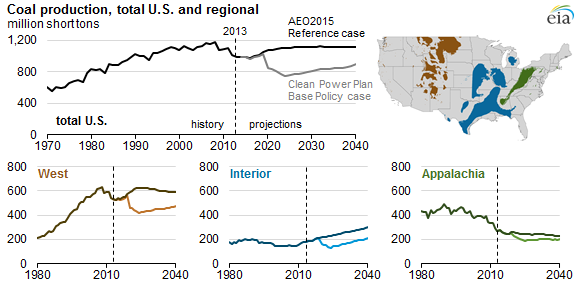
EIA's analysis of the Environmental Protection Agency's proposed Clean Power Plan rule shows U.S. coal production falling after the proposed rule takes effect. In 2024 in the Base Policy case, coal production falls to a level last seen in the late 1970s. Total production recovers gradually thereafter, as coal-fired generation increases in the later years of the projection, but it never surpasses levels reached in the 1980s. Production levels at all major coal basins are affected, but production in the West falls the most.
- Western coal production, which primarily includes the Wyoming Powder River basin, is 214 million tons (34%) lower by 2024 in the Base Policy case compared to the Annual Energy Outlook 2015 Reference case. Western coal production in the Base Policy case closes the gap with the Reference case to only 110 million tons (19% lower) but does not return to its 2013 production level by 2040.
- The Interior region, which primarily includes coal from the Illinois and Gulf-lignite basins, is 103 million tons (45%) lower by 2024 in the Base Policy case compared to the Reference case. After 2024, the region resumes a trend of increasing production, reaching 211 million tons in 2040 but still 88 million tons lower than projected levels without the proposed rule.
- Appalachian coal production in the Base Policy case is 46 million tons (19%) lower by 2024 compared to the Reference case, with total Appalachian production hovering around 200 million tons thereafter. In the Reference case, the power sector is projected to be less reliant on Appalachian coal, and the proposed rule accelerates this trend. The power sector consumed about 150 million tons Appalachian coal in 2013 (excluding stocks). That consumption falls to 106 million tons in 2040 in the Reference case and to 70 million tons in the Base Policy case. Nonpower sector use and exports account for the balance of Appalachian coal production.
Although the proposed Clean Power Plan rule results in less coal-fired electricity generation, several factors contribute to projected increases in coal generation from 2024 through 2040. Demand for electricity increases, and a combination of rising natural gas prices and increased renewable capacity translates to increased utilization at existing coal plants, even after significant amounts of coal capacity are retired. Also, in the Base Policy case, the standards set by the Clean Power Plan are assumed to remain constant after 2030. (The Policy Extension case examines a scenario in which the proposed rule is tightened after 2030.)
In terms of demand, the southeastern United States (South Census region) accounts for 75%, or 117 million tons, of the coal demand decline in 2040 compared to the AEO2015 Reference case.
EIA's Analysis of the Impacts of the Clean Power Plan also includes scenarios evaluating how assumptions of higher oil and natural gas resource availability and higher economic growth affect coal production and the power sector.
Principal contributor: EIA Staff