Under the proposed Clean Power Plan, natural gas, then renewables, gain generation share
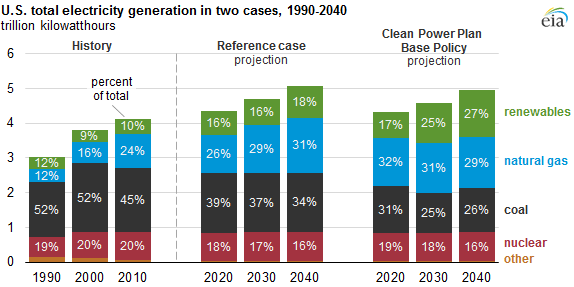
EIA's recently released analysis of the Environmental Protection Agency's proposed Clean Power Plan rule shows it would result in major changes in the fuel mix used to generate electricity in the United States.
Under the Base Policy case in EIA's analysis, which uses the Annual Energy Outlook 2015 (AEO2015) Reference case as its baseline, the main compliance strategy to lower emissions rates as the proposed rule comes into effect is to increase natural gas-fired generation to displace and ultimately surpass coal-fired generation. Later, as more wind and solar capacity are added, renewable generation also surpasses coal-fired generation.
Renewables and energy efficiency programs benefit from a compliance formula that counts renewable generation or, in the case of efficiency, avoided generation in the denominator of the compliance formula for existing fossil generation (i.e., emissions per unit of generation).
Changes in the fuel mix play out in different ways across the country, reflecting regional variation in the economics of increases in natural gas generation and renewable capacity. Key determinants include baseline combined-cycle utilization rates and the potential for renewable generation in areas without renewable portfolio standards.
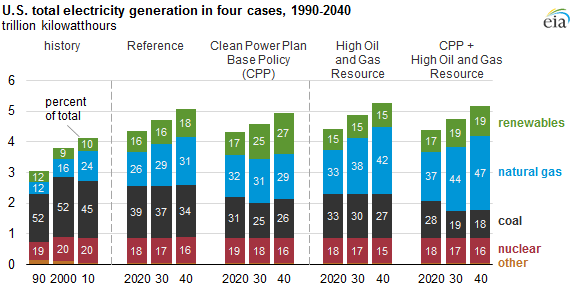
Future energy market conditions unrelated to the proposed Clean Power Plan rule can significantly affect the electricity generation mix and other key energy market outcomes. For this reason, EIA's analysis also modeled the proposed rule using the High Oil and Gas Resource (HOGR) and High Economic Growth cases from AEO2015 as alternative baselines. The HOGR case reflects a scenario in which more abundant domestic natural gas resources and better technology enhance natural gas supplies, keeping projected annual average spot natural gas prices below $4.50 per million Btu through 2040.
Even before the proposed rule is considered, natural gas plays a much larger role in the generation mix, largely at coal's expense, in the HOGR case than in the Reference case. In the Reference case, coal generation at existing coal plants is supported by a steady rise in natural gas prices beyond 2020, with annual average spot prices exceeding $7.50 per million Btu by 2040. When the proposed rule is modeled using the HOGR case as the baseline, natural gas plays a larger role in compliance, with the natural gas-fired share of total generation rising to 37% in 2020 and 44% in 2030. Renewables grow at a slightly lower rate, while the share of coal-fired generation declines to 28% in 2020 and 19% in 2030.
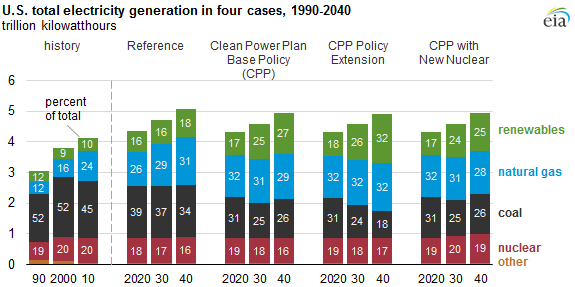
In addition to the Base Policy case, EIA's analysis includes several sensitivity cases encompassing different interpretations or implementations of the proposed rule as well as a scenario in which further emissions reductions are required beyond 2030, all of which use the AEO2015 Reference case as their baseline.
The Policy Extension case requires a further reduction in emissions rates between 2030 and 2040 rather than simply maintaining the 2030 standards through 2040. The impacts on fuels used to generate electricity are similar to those of the Base Policy case through 2030. However, generation from renewable energy sources continues to grow post-2030, ultimately accounting for 32% of generation by 2040, compared to 27% in the Base Policy case and 18% in the Reference case.
EIA also considered a case in which new nuclear units not already under construction were treated for compliance purposes similar to other non-carbon (i.e., renewable) generation. Under this case, nuclear capacity reaches 121 gigawatts by 2040, compared to 105 gigawatts of nuclear capacity in the Reference case and 102 gigawatts in the Base Policy case. The additional increase in nuclear generation replaces some of the growth in renewable generation.
The Clean Power Plan also has implications for electric generation capacity, both in terms of additions and retirements. These capacity changes will be the subject of a subsequent Today in Energy article.
Principal contributor: EIA Staff