
Energy efficiency improvements have largely offset effect of more, larger homes
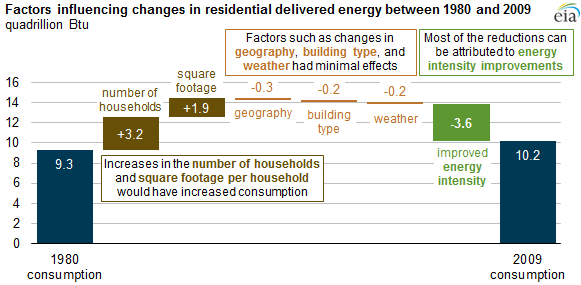
The growth in residential energy use has slowed to below the rate of household growth, meaning that per-household energy consumption has decreased. Analysis of EIA's Residential Energy Consumption Survey (RECS) conducted since 1980 shows how improvements in energy efficiency reduced energy intensity enough to offset more than 70% of the growth in both the number of households and the size of dwellings.
Between 1980 and 2009 (the most recent survey year), delivered energy used by U.S. households increased from 9.3 quadrillion British thermal units (quads) to 10.2 quads, an average growth of 0.3% per year. The change in delivered energy during this period can be broken into component factors, including number of households, structural changes (the mix of housing types, the geographic distribution of households, and changes in average floor area), weather, and energy intensity (measured here as consumption per square foot). After adjusting for the effects of the other factors, 2009 energy intensity declined (improved) by about 37% compared with the level in 1980, meaning that without this change, households would have required another 3.6 quads of delivered energy in 2009. The effects of reduced energy intensity are significantly greater when considered in terms of primary energy use, which takes into account that, on average, nearly three units of energy from primary fuels such as coal, natural gas, and nuclear fuel are used to generate one unit of electricity, which is a major part of energy use in households.
Energy intensity changes are influenced by factors such as energy prices, shifts in household energy fuel sources, consumer preferences for increased comfort and entertainment options, and increasingly efficient technologies. Programs designed to increase the adoption of efficient technologies such as residential appliance standards, building codes, incentives, energy labeling (such as the voluntary ENERGY STAR® program), and other informational programs also work to decrease consumption.
The gains from energy intensity improvements would have been even larger if it were not for consumer preferences for larger homes and increased adoption of home appliances and electronics. In this period, the average home size grew by about 20%. With increased square footage came adoption of more and larger devices such as more televisions with larger screens and new or expanding end uses such as computers, networking equipment, and home entertainment devices.
From 1980 to 2009, the population center of the United States continued to shift farther west and south, but this regional effect only lowered consumption by about 2.7%. Similarly, the makeup of the sector changed, as there was a shift away from detached (standalone) single-family homes and apartments in smaller buildings to attached single-family homes and apartments in larger buildings. Again, this effect was minimal, only accounting for a 1.7% reduction in energy consumption. Weather-related factors, which account for much of the variation in year-over-year comparisons, had little impact between 1980 and 2009, as these specific years had roughly similar weather.
Additional analysis of delivered energy consumption as well as separate sections for electricity and natural gas space heating are included in EIA's report on Drivers of U.S. Household Energy Consumption.
Principal contributors: Behjat Hojjati, Steve Wade