
Lower prices pull down natural gas reserves in 2012
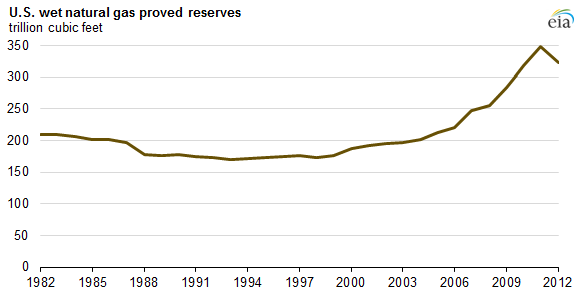
Lower natural gas prices drove down U.S. proved reserves in 2012, despite notable gains in the Marcellus and Eagle Ford shale gas plays. The decline stopped a 14-year trend of consecutive increases in natural gas reserves, according to newly published estimates in EIA's U.S. Crude Oil and Natural Gas Proved Reserves 2012.
Proved reserves are volumes of natural gas that geological and engineering data demonstrate with reasonable certainty to be recoverable in future years from known reservoirs under existing economic and operating conditions.
Natural gas proved reserves, estimated as wet natural gas that includes natural gas plant liquids, decreased 7% in 2012 to 323 trillion cubic feet (Tcf), as operators revised the proved reserves of their existing natural gas fields downward in response to lower natural gas prices (the natural gas spot price at the Henry Hub dropped below $2.00 per million British thermal units (MMBtu) in April 2012, a relatively low price level not experienced since December 2001).
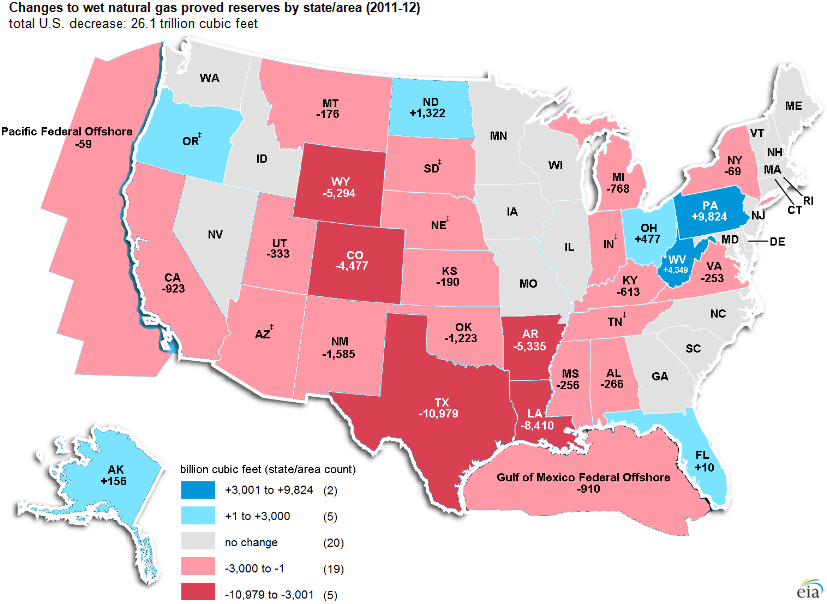
At the state level, Pennsylvania and West Virginia reported the largest net increases (9.8 Tcf and 4.3 Tcf, respectively) in natural gas proved reserves in 2012, driven by the continued development of the Marcellus Shale play. The Marcellus Shale play became the largest shale play (ranked by proved reserves) in the United States in 2012. Proved reserves in shale gas plays accounted for 40% (129.4 Tcf) of U.S. wet natural gas proved reserves in 2012. However, gains in the Marcellus (10.9 Tcf) and Eagle Ford (7.8 Tcf) shale plays were more than offset by price-driven reductions in more mature shale plays (the Barnett and the Haynesville declined a combined 20.7 Tcf) in 2012.
EIA's estimates of proved reserves at the end of 2012 are based on an annual survey of domestic oil and gas well operators. EIA anticipates that proved natural gas reserves for 2013 will be affected positively by the recovery in natural gas prices from 2012 to 2013. From 2012 to 2013, the average natural gas spot price at the Henry Hub, used to estimate reserves (12-month, first-trading-day-of-the-month price), increased from $2.75 to $3.66 per MMBtu.
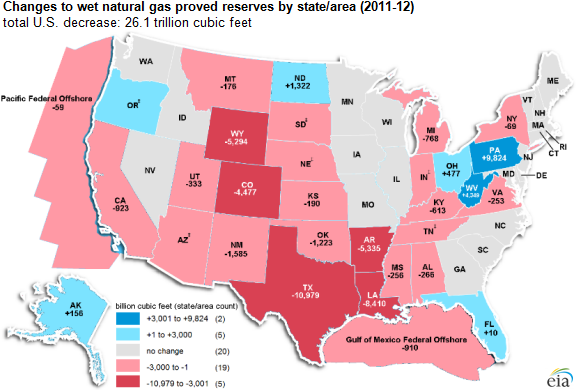
Note: ǂ indicates data withheld to avoid disclosure of individual company data.
Note: Click to enlarge.
For more information on U.S. crude oil and natural gas proved reserves, see the full U.S. Crude Oil and Natural Gas Proved Reserves report.
Principal contributor: Steven Grape
Tags: Alaska, crude oil, Eagle Ford, liquid fuels, map, Marcellus, natural gas, Pennsylvania, shale, tight oil, West Virginia