
Rail congestion, cold weather raise ethanol spot prices
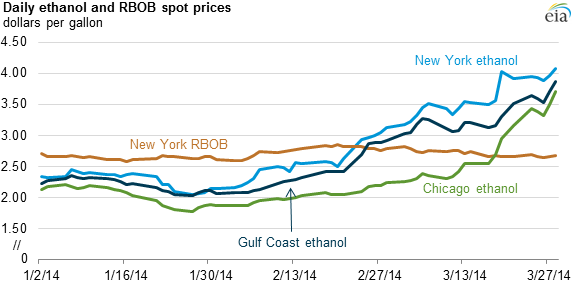
Note: RBOB is reformulated blendstock for oxygenate blending gasoline, a motor gasoline blending component intended for blending oxygenates to produce finished reformulated gasoline.
Ethanol spot prices have increased steadily since early February. By late March, New York Harbor (NYH) spot ethanol prices exceeded prices for RBOB (the petroleum component of gasoline) by more than $1 per gallon. Ethanol spot prices in Chicago and Gulf Coast markets also rose above NYH RBOB prices.
The premium of New York Harbor over Chicago spot ethanol prices, which averaged 25 cents per gallon in January (close to the typical transportation costs of moving ethanol from production centers in the Midwest to terminals on the East Coast in recent years) widened to $1 per gallon in early March. Logistical constraints in and around ethanol production centers in the Midwest, mainly involving railroads on which approximately 70% of ethanol is shipped, appear to be a key factor driving recent prices.
Ethanol futures prices suggest that market participants expect the recent price increase to be short-lived as both rail system congestion improves and ethanol producers respond to the strong incentive that higher ethanol prices provide.
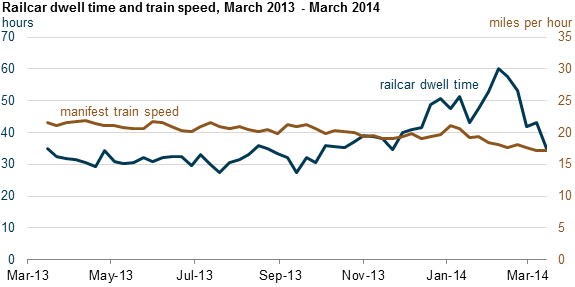
Note: Manifest trains combine cars carrying different products and are often broken up for delivery in a smaller number of cars. Railcar dwell time is the time that loaded railcars spend in a terminal awaiting movement.
Extremely cold temperatures this winter led to rail congestion in and out of midwestern terminals that delayed shipments to other regions and resulted in significant ethanol stock draws. Railcar dwell time, the time that loaded railcars spend in a terminal awaiting movement, at Burlington Northern Santa Fe Corporation’s Galesburg, Illinois terminal, which handles many ethanol cars from Iowa, nearly doubled in early 2014 to reach a peak of 60 hours in February and remain above year-ago levels.
While more than 70% of ethanol producers are equipped to load unit trains (trains running a single product), only about 35% of gasoline blending terminals are equipped to receive them. The average speed of manifest trains (trains running multiple products), which are often used to deliver ethanol to gasoline blending terminals that are not equipped to handle unit trains, decreased by 23%, from 22 miles per hour (mph) to 17 mph over the past 12 months.
Ethanol stocks were drawn down nationwide by nearly 2 million barrels (bbl) from mid-February to mid-March, partially recovering to 15.9 million bbl on March 28. This is more than 4 million bbl below typical March levels, which averaged more than 20 million bbl from 2011 through 2013. East Coast inventories were especially hard hit and on March 14 reached their lowest level (4.5 million bbl) since EIA began recording data in June 2010. For a more detailed analysis, see the April 2 edition of This Week in Petroleum.
Principal contributors: Arup Mallik, Sean Hill
Tags: biofuels, ethanol, gasoline, inventories/stocks, rail, transportation