Released: April 2, 2014
Next Release: April 9, 2014
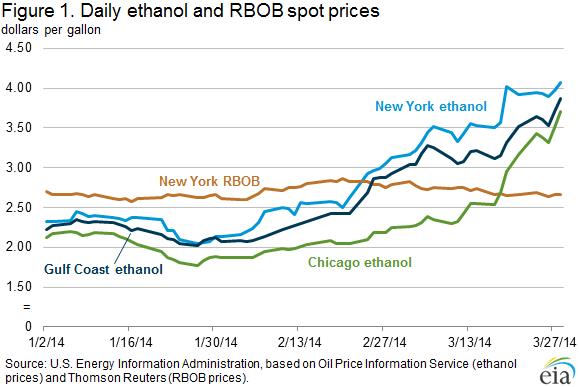
Rapid rise in ethanol prices since early February reflects logistical problems
Ethanol spot prices have increased steadily since early February. By late March, New York Harbor (NYH) spot ethanol prices exceeded prices for RBOB (the petroleum component of gasoline) by more than $1 per gallon (Figure 1). Ethanol spot prices in Chicago and Gulf Coast markets also rose above NYH RBOB prices. The premium of NYH over Chicago spot ethanol prices, which had averaged roughly 25 cents per gallon in January, close to the typical transportation costs of moving ethanol from production centers in the Midwest to terminals on the East Coast in recent years, widened to $1 per gallon in early March. Logistical constraints in and around ethanol production centers in the Midwest, mainly involving railroads on which approximately 70% of ethanol is shipped, appear to be a key factor driving recent prices.
Ethanol futures prices suggest that market participants expect the recent price increase to be short-lived. The Chicago Board of Trade (CBOT) ethanol futures curve is heavily backwardated, meaning near-term contracts are selling at a premium to longer-term contracts. On March 31, the futures contract price for May 2014 delivery was more than $1 per gallon below the Chicago spot price for immediate delivery. Rail system conditions appear to be improving. In addition, the recent ethanol price increase has driven ethanol operating margins and crush spreads to their highest values in recent years, providing a strong incentive for increased ethanol production rates over the coming weeks.
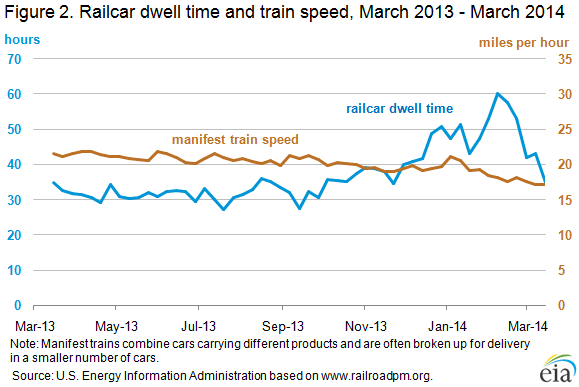
Extremely cold temperatures this winter led to rail congestion in and out of Midwestern terminals that delayed shipments to other regions and resulted in significant ethanol stock draws. Railcar dwell times, the time loaded railcars spend in a terminal awaiting movement, at Burlington Northern Santa Fe Corporation's Galesburg, Illinois terminal, which handles many ethanol cars from Iowa, nearly doubled in early 2014 to reach a peak of 60 hours in February and remain above year-ago levels (Figure 2). While over 70% of ethanol producers are equipped to load unit trains, only about 35% of gasoline blending terminals are equipped to receive them. The average speed of manifest trains, which include cars carrying different products and are often used to deliver ethanol to gasoline blending terminals that are not equipped to handle unit trains, decreased by 20%, from 22 miles per hour (mph) to 17 mph, over the past 12 months.
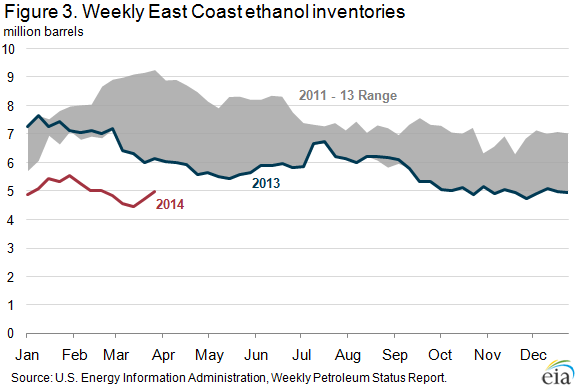
Ethanol stocks were drawn down nationwide by nearly 2 million barrels (bbl) from mid-February to mid-March, partially recovering to 15.9 million bbl on March 28. This is more than 4 million bbl below typical March levels, which averaged more than 20 million bbl from 2011 through 2013. East Coast inventories (Figure 3) were especially hard hit and on March 14 reached their lowest level (4.5 million bbl) since EIA began recording data in June 2010.
Despite an abundant corn supply and strong ethanol margins in early 2014, ethanol production rates also appear to be have been adversely affected by rail system problems and other weather-related issues in recent months. After averaging over 0.9 million bbl per day for four consecutive months beginning in November 2013, ethanol production has fallen below 0.9 million bbl per day during March 2014.
Gasoline prices mostly higher, diesel fuel flat to lower
The U.S. average retail price of regular gasoline increased by three cents this week to $3.58 per gallon as of March 31, 2014, down seven cents from this time last year. The Midwest had the largest price increase, up four cents to $3.59 per gallon. The East Coast and West Coast prices each increased three cents, to $3.56 and $3.85 per gallon respectively. The Gulf Coast price increased by two cents to $3.34 per gallon. The Rocky Mountain price decreased by a penny to $3.45 per gallon.
The national average diesel fuel price decreased by a penny to $3.98 per gallon, two cents less than the same time last year. Diesel fuel prices decreased in all regions except on the Gulf Coast, where the price remained flat at $3.80 per gallon. The largest price decrease for diesel fuel was on the East Coast, which fell by just over two cents to $4.09 per gallon, but is still the highest price in the nation. The Midwest and West Coast prices each decreased by two cents, to $3.96 and $3.99 per gallon, with the West Coast below $4 per gallon for the first time in seven weeks. The Rocky Mountain diesel fuel price decreased by less than a penny, but remains at $3.98 per gallon for a second week.
Propane inventories gain
U.S. propane stocks increased by 0.9 million barrels last week to 26.6 million barrels as of March 28, 2014, 13.2 million barrels (33.1%) lower than a year ago. Midwest inventories increased by 0.5 million barrels and Gulf Coast inventories increased by 0.4 million barrels. Rocky Mountain/West Coast inventories and East Coast inventories both remained unchanged. Propylene non-fuel-use inventories represented 12.5% of total propane inventories.
Text from the previous editions of This Week In Petroleum is accessible through a link at the top right-hand corner of this page.
 |
 |
||||||
| Retail Data | Change From Last | Retail Data | Change From Last | ||||
| 03/31/14 | Week | Year | 03/31/14 | Week | Year | ||
| Gasoline | 3.579 | Diesel Fuel | 3.975 | ||||
 |
 |
||||||||||||||||||||||||||
|
 |
||||||||||||||||||||||||||
| *Note: Crude Oil Price in Dollars per Barrel. | |||||||||||||||||||||||||||
 |
 |
||||||
 |
 |
||||||
| Stocks Data | Change From Last | Stocks Data | Change From Last | ||||
| 03/28/14 | Week | Year | 03/28/14 | Week | Year | ||
| Crude Oil | 380.1 | Distillate | 113.0 | ||||
| Gasoline | 215.6 | Propane | 26.568 | ||||