
North Dakota oil production reaches new high in 2012, transported by trucks and railroads
Republished: March 18, 2013, 9:30 a.m.: Text was modified to clarify content.
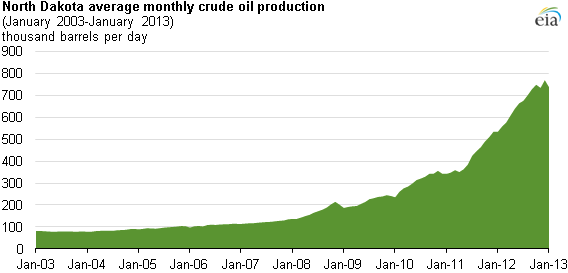
North Dakota crude oil production (including lease condensate) averaged an all-time high of 770,000 barrels per day in December 2012. Total annual production more than doubled between 2010 and 2012 through the use of horizontal drilling and hydraulic fracturing of deposits in the Bakken Formation in the Williston Basin. North Dakota production in 2012 trailed only Texas and the U.S. Federal Offshore region, and the state accounted for 10% of total U.S. crude oil production.
Much of crude oil production in North Dakota is gathered and transported by truck to railcars leaving the state. In the four counties where production is concentrated, about 75% of production is transported by truck, and this can cause supply chain problems at times. Severe weather can impede truck travel, which may lower oil production in the state. Once on-site storage tanks at production sites are full, production stops until the trucks can move again. For example, in November 2012 North Dakota crude oil production fell slightly from the October level to 735,000 bbl/d because of weather-induced transportation problems caused by an unusually heavy snowstorm. Pipeline networks, which can be more efficient and less subject to storm disruptions than trucking, are currently being expanded.
Weather slowing or halting truck transportation can also affect the completion of wells that are not yet producing. According to the North Dakota Department of Mineral Resources (DMR), almost all (95%) wells drilled in North Dakota use hydraulic fracturing to produce the crude oil embedded in shale rock and tight (low permeability) formations. To start production, each well needs hundreds of truckloads of material (900-2,000, including 800 truckloads of water, according to the DMR) on-site that are delivered by tank trucks to storage tanks, unless a sufficient quantity of water is available at the wellsite. The total amount of water needed for hydraulic fracturing must be at the wellsite before hydraulic fracturing can begin.
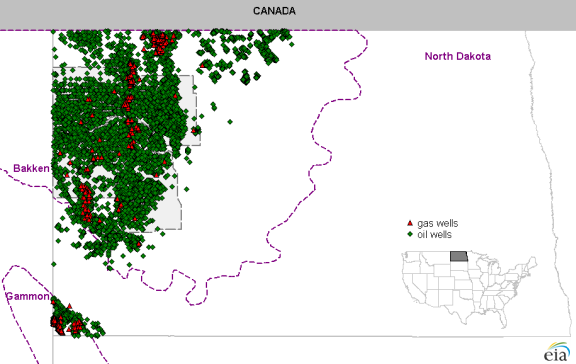
Because over 80% of North Dakota's wells are located in only four counties—Dunn, McKenzie, Montrail, and William—in the northwest area of the state (see map), harsh weather in these areas can reduce the state's total crude oil production, as happened in November 2012 and again in January 2013.
Tags: crude oil, liquid fuels, map, North Dakota, oil/petroleum, production/supply, states, tight oil, weather