
Heating and cooling no longer majority of U.S. home energy use
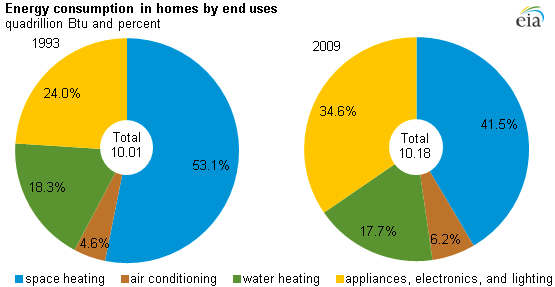
Note: Amounts represent the energy consumption in occupied primary housing units.
For decades, space heating and cooling (space conditioning) accounted for more than half of all residential energy consumption. Estimates from the most recent Residential Energy Consumption Survey (RECS), collected in 2010 and 2011 and released in 2011 and 2012, show that 48% of energy consumption in U.S. homes in 2009 was for heating and cooling, down from 58% in 1993. Factors underpinning this trend are increased adoption of more efficient equipment, better insulation, more efficient windows, and population shifts to warmer climates. The shift in how energy is consumed in homes has occurred even as per-household energy consumption has steadily declined.
While energy used for space conditioning has declined, energy consumption for appliances and electronics continues to rise. Although some appliances that are subject to federal efficiency standards, such as refrigerators and clothes washers, have become more efficient, the increased number of devices that consume energy in homes has offset these efficiency gains. Non-weather related energy use for appliances, electronics, water heating, and lighting now accounts for 52% of total consumption, up from 42% in 1993. The majority of devices in the fastest growing category of residential end-uses are powered by electricity, increasing the total amount of primary energy needed to meet residential electricity demand. As described in yesterday's Today in Energy, increased electricity use has a disproportionate effect on the amount of total primary energy required to support site-level energy use.
Other notable trends in household energy consumption include:
- The average U.S. household consumed 11,320 kilowatthours (kWh) of electricity in 2009, of which the largest portion (7,526 kWh) was for appliances, electronics, lighting, and miscellaneous uses.
- On average, residents living in homes constructed in the 1980s consumed 77 million Btu of total energy at home. By comparison, those living in newer homes, built from 2000 to 2009, consumed 92 million Btu per household, which is 19% more.
- Space heating accounted for 63% of natural gas consumed in U.S. homes in 2009; the remaining 37% was for water heating, cooking, and miscellaneous uses.
In the past, EIA reported household energy data for the United States, for census regions and divisions, and for the four most populous states: California, Texas, New York, and Florida. In the 2009 RECS, EIA expanded the household data series to include 12 more states: Arizona, Colorado, Georgia, Illinois, Massachusetts, Michigan, Missouri, New Jersey, Pennsylvania, Tennessee, Virginia, and Wisconsin.
Tags: consumption/demand, residential, states